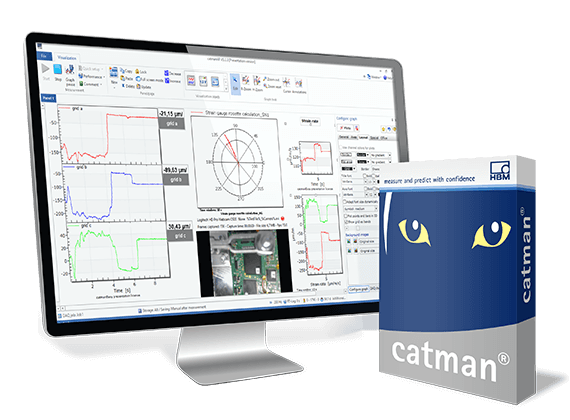
catman Data Acquisition Software: Connect. Measure. Visualize. Analyze.
With catman data acquisition software (DAQ software) you can easily acquire, visualize, and analyze your measuring data – immediately or post process. Whether it is in mobile field tests, lab based component testing, bench testing or monitoring tasks: catman is up to any challenge.
Easy Setup
- Intuitive Handling – no programming skills necessary
- Optical & electrical measurement chain support
- Automatic channel set up with TEDS
- Integrated sensor database incl. creation of individual sensors and linearization
- Acquire vehicle bus (CAN/CAN FD) and analog measured data in parallel and synchronously
- Open DAIO-interface integrating any hardware
- Integration of 3rd party devices (e.g. Vaisala Weather station)
Powerful Visualization
- Live processing of any incoming data (electric power, Rainflow, and rosette calculation)
- Numerous data visualization possibilities (over time, frequency, angular)
- GNSS/GPS data visualization on maps
- Full video support in parallel to measuring data
- Support of multiple panels or screens and ready for touch operation
- Easy touch-screen operation even in harsh environments
- Enhanced monitoring and active notifications
- Remote and safe view via a web browser
Flexible Data Analysis & Handling
- Easy-to-use data cleansing tools
- Powerful post-processing analytics
- Compare large data sets
- Scripting for functional enhancement or workflow automation
- Export data into any format: ASCII, EXCEL, DIAdem, MTS RPC III, MATLAB, NI TDMS, nCode s3t, Vector MDF 3/4, nSoft DAC, UFF58, etc.
- Automated reporting into Office template
- Data viewer for post-processing (nCode Viewer)
A Valuable Tool for Any Application


What Our Customers Say About Us
We have been using HBM's catman AP data acquisition software in structural testing for several years. We appreciate the usability, reliability and enormous range of functions. Without catman, we would not run a measurement analysis! HBM offers first-class support and an integrated knowledge base, responding to new possible improvements and questions very fast.
Werner Malgut, University of Applied Sciences Bremen, Institute for Experimental Statics
Make Your Measurement Project a Success
An Introduction to catman
First Measurement in catman
Tips & Tricks for catman
Learn more about the different functionalities of catman. Check out our video tutorials, tech-notes, seminars and case studies on catman.
Discover catman's Functionalities - Click Through the Gallery


Choose the Right catman Package for Your Needs

catman®Easy
catman Easy is the basic version which includes online and offline setup, online visualizations, and online maths as well as recording functionalities. catman Easy can be combined with two different add-on modules:
- EasyMath: Mathematics module and auto sequences for catman Easy.
- EasyScript: Free programming under VBA in measurement and analysis mode.

catman®AP
catman AP adds powerful modules to the full catman Easy software package, such as:
- GNSS/GPS data visualization on maps
- Video Recording
- Wheelforce transducer integration
- Parallel Recording
- Cloud data streaming

catman®PostProcess
catman PostProcess offers various post-process tools to process, analyze and report your results, such as:
- Curve operations (peak value detection, cut & smooth data, remove peaks)
- Math functions (e.g. strain gauge rosette calculation, electric power calculation)
- Data visualization
- Video replay
- Statistics & Classifications (e.g. rainflow counting, time-at-level)
- Data export & Report
catman Upgrade and Maintenance Packages
To get the best out of your software and measurement project we offer you additional upgrades and maintenance packages:
- catman AP Upgrade: Upgrade your catman Easy into the catman AP software package and benefit from the comprehensive range of functionalities within catman AP.
- catman Easy Software Maintenance and catman AP Software Maintenance: With the 12-month or 24-month software maintenance contract you will gain a direct access to the HBM technical support and free of charge catman software updates released during maintenance period. Notification on new software versions will be sent via e-mail and, once registered, directly through the software. catman licenses are available for use without any time limitation and are not bound to a maintenance contract.
Information about your license status and license renewals can be obtained at any time via [email protected]. Please provide your license number and contract number.
catman Enterprise
Besides the catman software packages, catman is also available in an enterprise version for test with up to 20,000 measurement channels - ideal for aerospace applications.
nCode Viewer
Your measurement project requires a large team? Use the free of charge nCode Viewer for your catman projects to visualize and analyze your measurement data.
Compare the Functionalities of catman Software Packages
| catman Easy | catman AP | catman PostProcess | |
| Automatic channel set up with TEDS | |||
| Writing and reading TEDS | |||
| Expandable and integrated sensor database | |||
| Read Excel with channel parameterization | |||
| Offline parameterization |
| catman Easy | catman AP | catman PostProcess | |
| Data acquisition with up to 12 MS/s or 100 MB/s | |||
| Live visualization of measurement data | |||
| Video integration | |||
| Integration of GPS data | |||
| GPS data visualization on geographical maps | |||
| Measurement and data acquisition jobs | |||
| Store in different data formats |
| catman Easy | catman AP | catman PostProcess | |
| General scientific math | |||
| Structural durability testing math | |||
| Electric power math | |||
| Noise analysis | |||
| Human Body vibration filters according to EN ISO 8041 |
| catman Easy | catman AP | catman PostProcess | |
| Graphical data visualization | |||
| GPS data visualization on geographical maps | |||
| Data cleansing and preparation: curve operation, statistics | |||
| Video based data analysis | |||
| General scientific math | |||
| Structural durability testing math | |||
| Noise analysis | |||
| Human Body vibration filters according to EN ISO 8041 | |||
| Export data and report test result |
| catman Easy | catman AP | catman PostProcess | |
| Auto sequencer | |||
| Scripting |
| catman Easy | catman AP | catman PostProcess | |
| Device configuration | |||
| I/O parameterization | |||
| CAN/FD parameterization via DBC file | |||
| Diagnostics | |||
| Parameterization and data acquisition of optical interrogators | |||
| Integration of Kistler RoaDyn sensors | |||
| 12-month software maintenance included |
System requirements: Windows 8 / 10 / 11 (32 and 64 Bit). Supported interfaces: Ethernet PC interface, DAIO interface for connection of any measurement hardware, USB-based GPS devices, and video cameras with DirectShow interface.
New Features in catman 5.6.2
- MQTT;
- Improvements to MXFS SI integration;
- Improved handling of large CAN Datasets;
- Several other bug fixes and performance improvements.
Interested in catman?
Get your free trial version of catman data acquisition software and test the different functionalities within 25 program starts.
catman University Packages
You are a student or teaching at a university? Contact us for our attractive catman university packages.

Benefit from our Excellent Service and Support
- Software maintenance packages for catman Easy and catman AP (12 and 24 months)
- Twelve-month software maintenance package included after purchase including software updates
- Simple and convenient upgrade from catman Easy to catman AP with extended functionalities
- Our professional technical support center will assist you by email, telephone and/or remote
- Get your catman knowledge up to date with our HBK Academy and benefit from a 15% discount after purchase
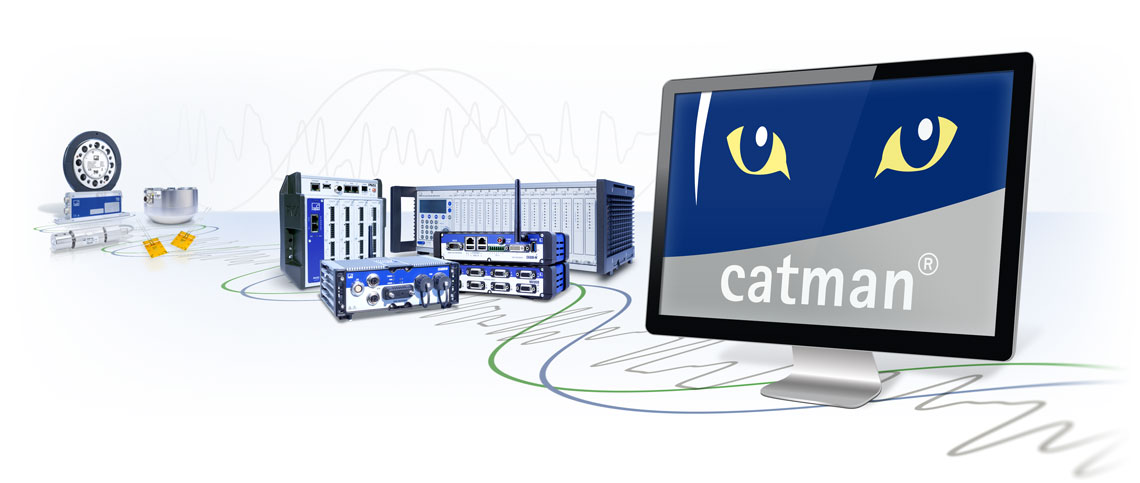
catman and the Supported Hardware

QuantumX - Universal and Distributable
The DAQ system QuantumX is the perfect tool for data acquisition of almost all physical quantities and sensor technologies.

MXFS - Seamless Optical Measuring Chain
MXFS Optical Measurement Module for thermal validation and structural health applications.

SomatXR – Ultra-rugged and flexible
The rugged SomatXR DAQ system is extremely reliable and protected against humidity, dust, shock, and vibration.

MGCplus - Low to High Channel Counts
Whether it is for calibration or fatigue tests: the MGCplus DAQ system acquires many different quantities, like torque and current.
Obituary: The universe doesn’t allow perfection
Our catman software is used in many industries around the world and is the result of Heiko’s pioneering work. The software developer from Sailauf in Bavaria, Germany, started as a laboratory technician at HBM Darmstadt in 1986 and is considered the inventor of the powerful test & measurement software aimed at achieving results without any programming at all. Now our former colleague died suddenly and after only 2 years in well-deserved retirement on 21st October 2021.
Together with a small team, he has paved the way for modern, networked, and efficient PC-based measurement data acquisition over 17 years. Thousands of products have since been physically measured, analysed and improved using the measurement and analysis software. Heiko has left a huge void in our lives—that will be confirmed by anyone who has known him and worked with him.
Documents & Downloads
| Title / Description | Language | Products | Language | Content Types |
|---|---|---|---|---|
| Data Sheets | ||||
| catman - Caractéristiques techniques | French | |||
| catman - Data Sheet | English | |||
| catman - Datenblatt | German | |||
| Operating Manuals | ||||
| catman - Bedienungsanleitung | German | |||
| catman - Operating Manual | English | |||
| Quick Start Guides | ||||
| catman - Quick Start Guide | French, German, English | |||
| Software | ||||
|
catman Easy / AP / PostProcess
Software for data acquisition, visualization, analysis and reporting of measurement data for your PC or QuantumX/SomatXR Data Recorder. Date: 09/2023
|
Version: 5.6.2
|
Size: 473 MB
| Multilanguage | |||
|
Plugin for DIAdem / catman
This plugin allows you to open .bin files from HBM catman directly in DIAdem. Date: 07/2013 | Version: 1.9.0 | Size: 74 KB | Multilanguage | |||