Aug 29 2019
Temperature Compensation of Strain Gauges
Read More
Clear, brief and understandable link between theory and practice of temperature compensation for 1/4 bridge strain gauge applications.
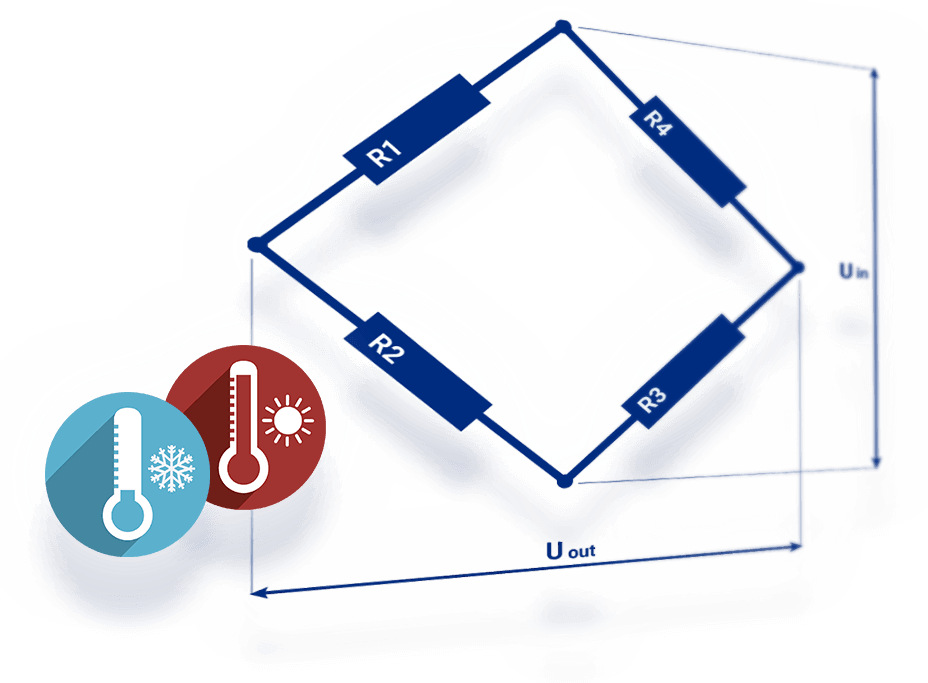
To ensure accurate measurement results even under changing ambient conditions, temperature compensation of quarter bridge strain gauge applications need to be established. Several different temperature factors influence the physical strain on its way to digitalization, such as:
These temperature influences can be corrected by using software packages designed for strain gauge applications such as catman Easy/AP from HBK. We will give you a clear and understandable link between theory and practice of temperature compensation for quarter bridge strain gauge applications.
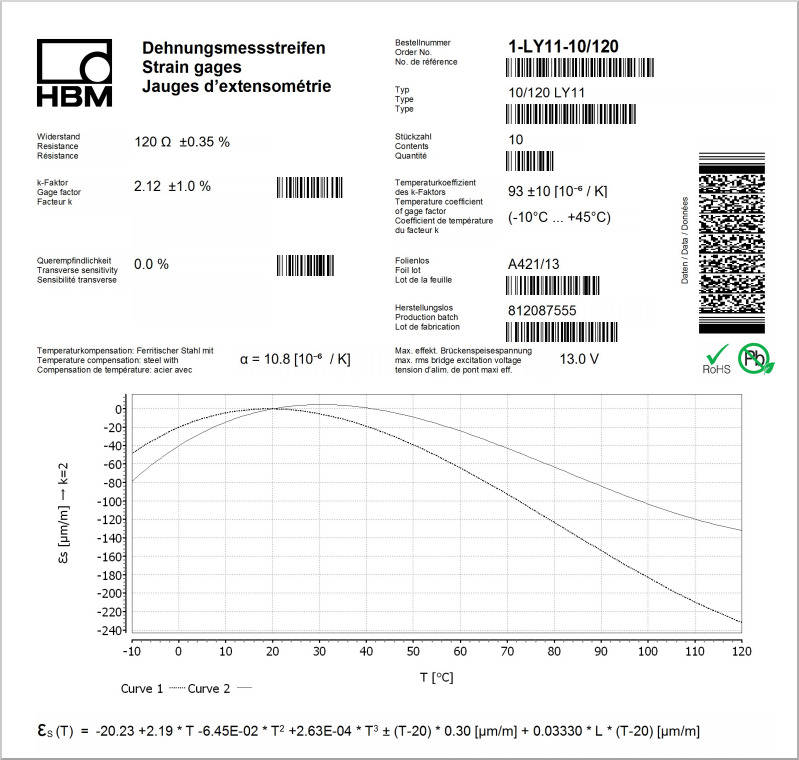
Strain gauges from HBK are shipped with a data sheet, containing all relevant parameters to ensure the accuracy of the measurement. The HBK strain gauge data sheet has the following layout and displays the parameters for compensation in a chart and formula. Annotation: In this example, two curves are displayed in the data sheet. One curve represents the thermal response of the strain gauge itself while the other curve represents the thermal behavior of the gauge including 2-wire leads.
The temperature response of a strain gauge depends on:
In practice, the thermal output strain is simply measured and extracted in a temperature chamber under accurate conditions. The result of this measurement reflects:
The residual error can be determined from the measurement and represented by a polynomial εs, which ideally would always give zero as the result, regardless of temperature. But in practice there is a range around the reference temperature, where it is optimised close to zero during production of the strain gauge.
The thermal polynomial is plotted on each data sheet. The general layout is as follows - please be aware, that the polynomial can vary:
![]()
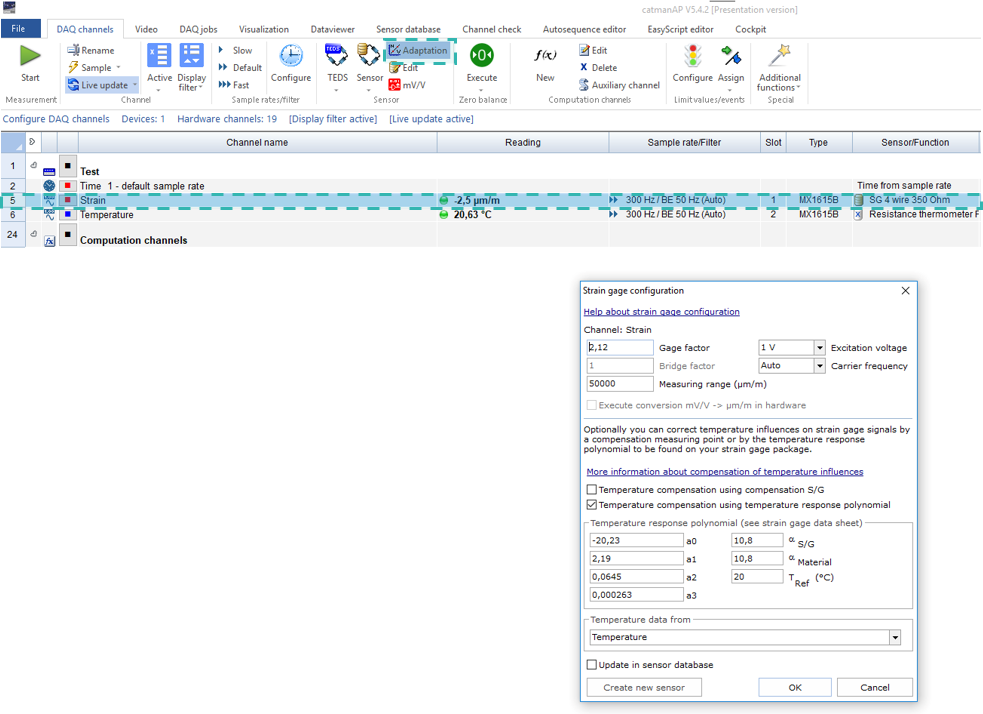
In catman Easy/AP the thermal compensation for the strain gauge can easily be added by clicking on “Adaption” in the ribbon bar of the DAQ channels. All parameters can be found in the data sheet.
In some cases, the polynomial includes further contributors that influence the strain signal if the temperature changes:
The adapted polynomial is as follows:
![]()
Focusing on our application example it looks like:
![]()
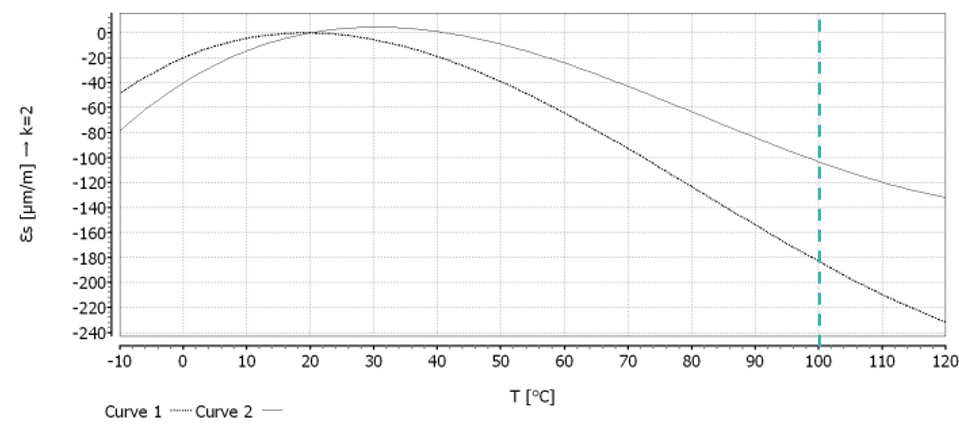
Let’s assume that the temperature during the strain measurement is constantly 100 °C (T = 100 °C) and the length of leads is 10 mm (L = 10 mm). Please be aware that the length of leads can vary. Looking at the polynomial, it demonstrates that the thermal strain has a significant impact on the result, since it is higher than 100 μm/m!
To calculate the thermal output strain, deploy the temperature and the length of leads into the polynomial:

The result fits quite well to the polynomial displayed on the data sheet. By considering the polynomial the most significant influences are taken into account, whereas only very long 2-wire cables can impact the result additionally. Since we use the 3- and 4-wire technology that compensates the impact of cable resistance, this part of the calculation is not relevant!
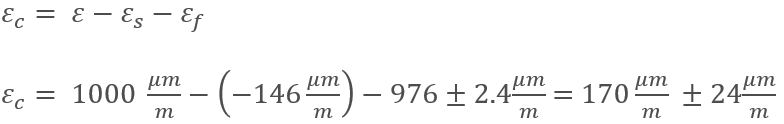
Superimposing the thermal strain on the measured strain now gives the corrected strain value, which only takes the mechanical strain into account:
![]()
The polynomials of most manufacturers are measured with a fixed gauge factor (or k-factor) of k = 2, whereas the real measured k-factor typically differs. This effect is mainly visible in extreme conditions, such as high and low temperatures or high strains. To compensate the variations which can influence the temperature compensation, the gauge factor printed on the data sheet should be considered.
Therefore, multiplicate the quotient of the gauge factors printed on the data sheet to correct the thermal output that can be expected with the strain gauge. In this case we have the following gauge factors:

Of course, the thermal strain correction is only applied to the polynomial and must not be applied to additionally contributing factors as measurement uncertainty or the influence of leads:

In this case, we have two gauge factors (kpolynomial = 2.0 and kdata_sheet = 2.12). The thermal strain correction would be:

The corrected strain signal would change to:
![]()
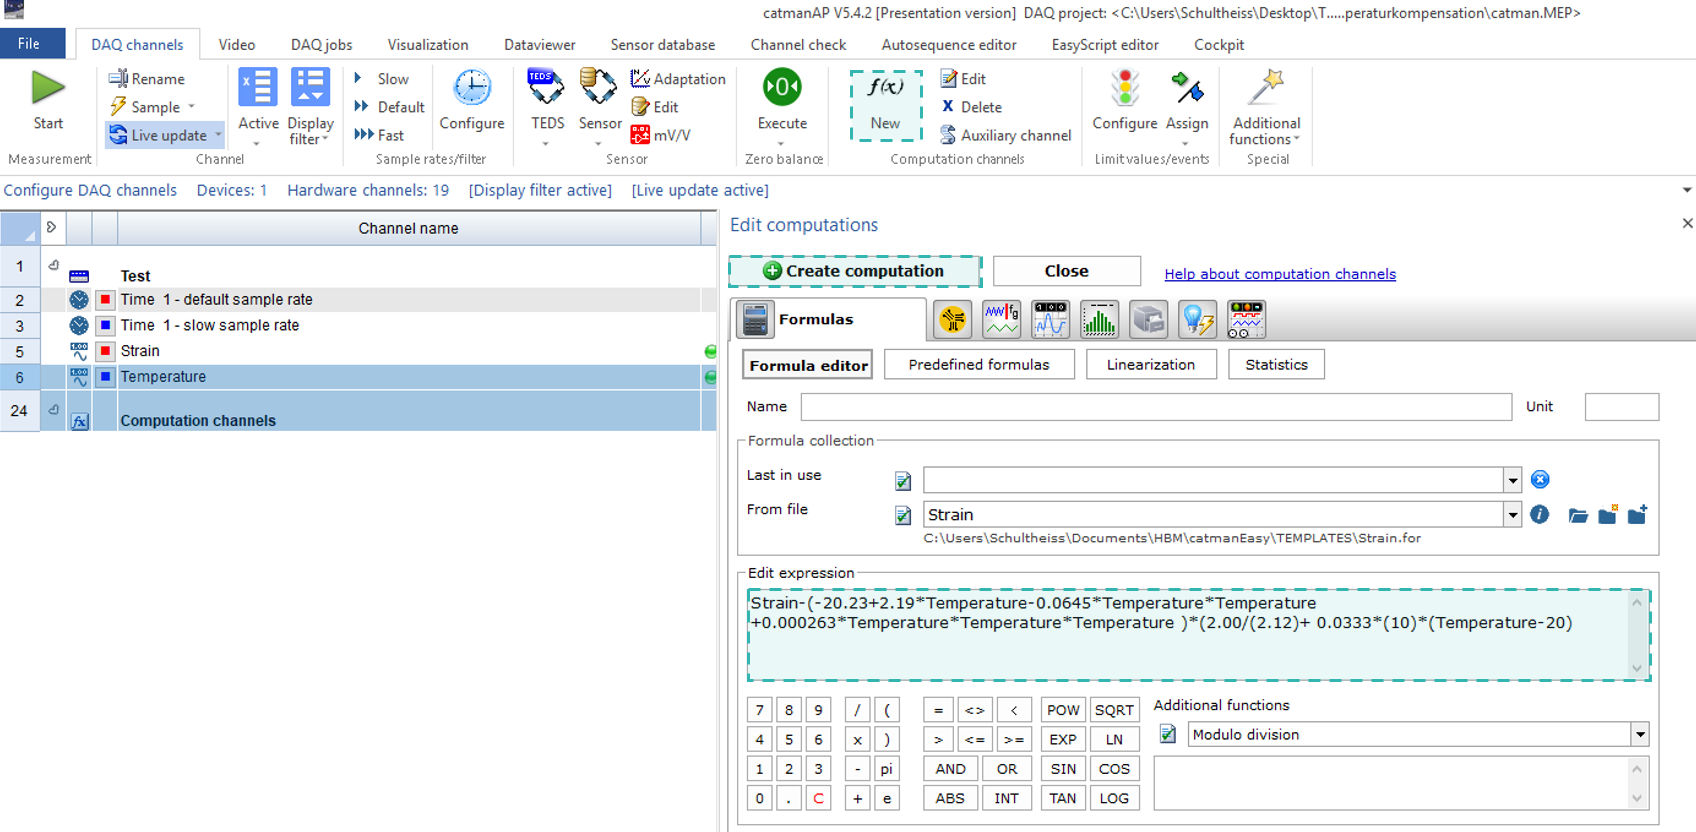
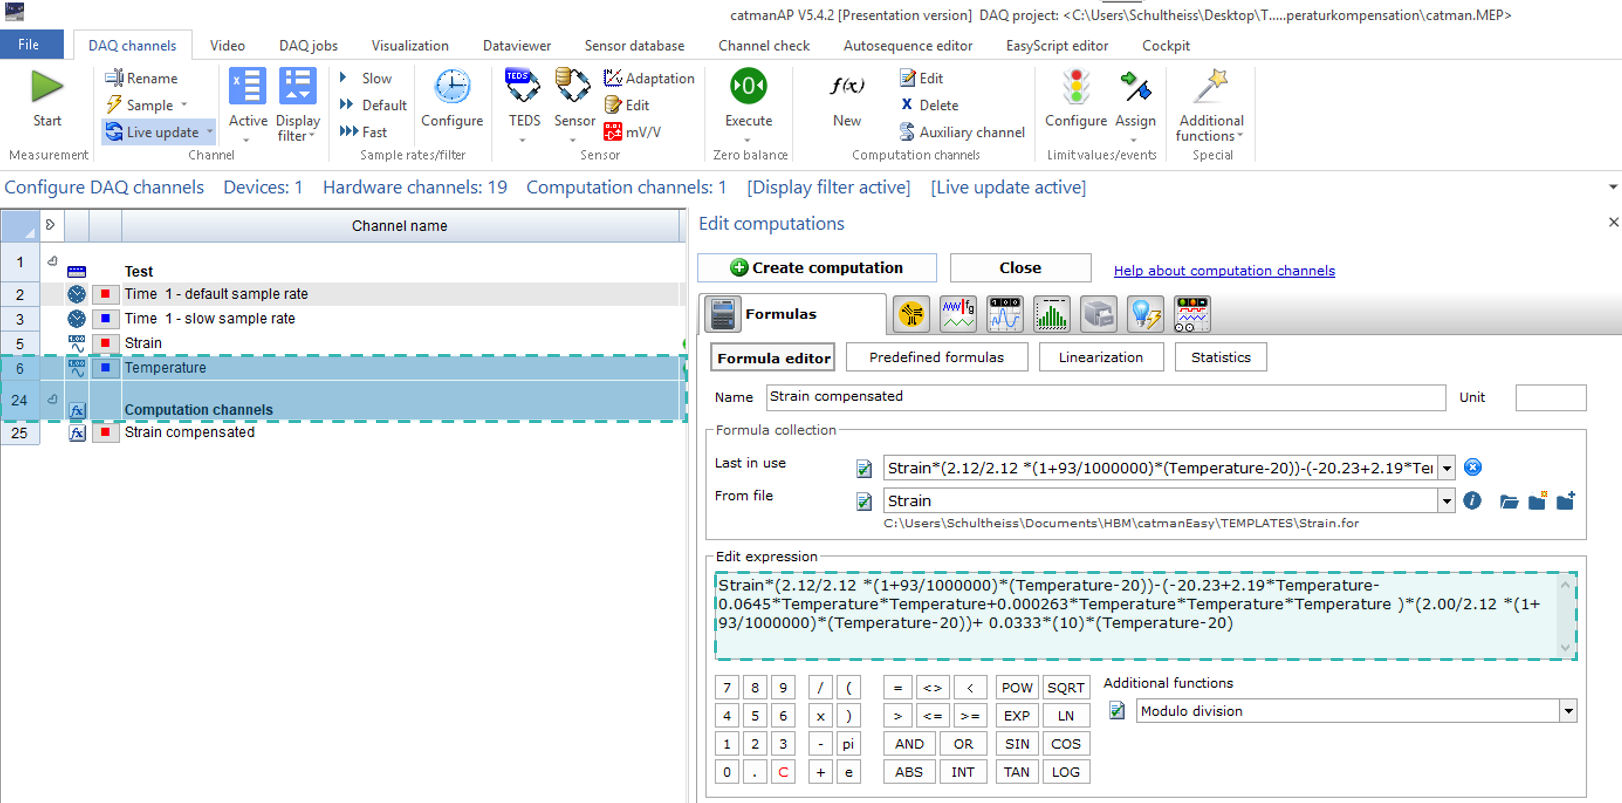
To establish this correction in catman DAQ software a new calculation channel needs to be created which consider all factors. A computation channel can be added by clicking on "New Computation Channels" and "Create a new Channel". The strain signal can be corrected by inserting the thermal strain correction polynomial into the "Edit Expression" of the new computation channel.
In this theoretical test case, the temperature coefficient of the strain gauge matches the material perfectly. Nevertheless, in practice, there might be slight deviations between temperature coefficient of the substrate material and the temperature coefficient to which the strain gauge has been adapted. An approximate adjustment to correct the measured strain value is given by the following formula. In this case, we assume that a strain gauge adapted to ferritic steel (10.8 ppm/K) was used on an aluminium (23 ppm/K):
![]()
The temperature difference must be calculated from the reference temperature and the temperature during test. The reference temperature is the temperature the strain gauge data sheet refers to and for which the parameters have been measured:
![]()
This will lead to the following correction factor:
![]()
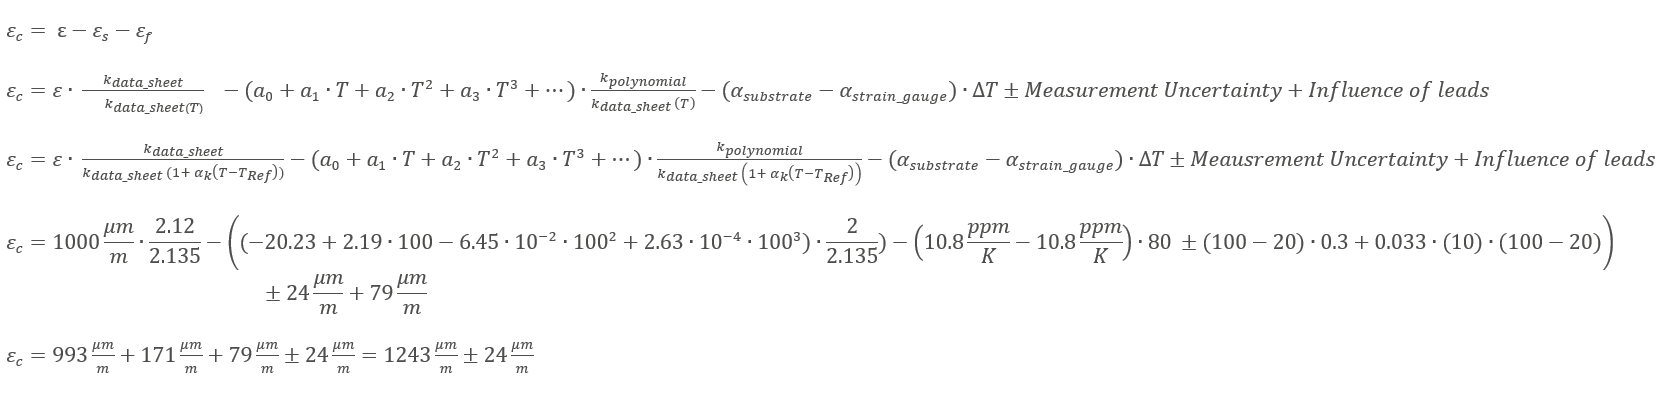
If this is considered for the corrected strain value, the overall equation is obtained:
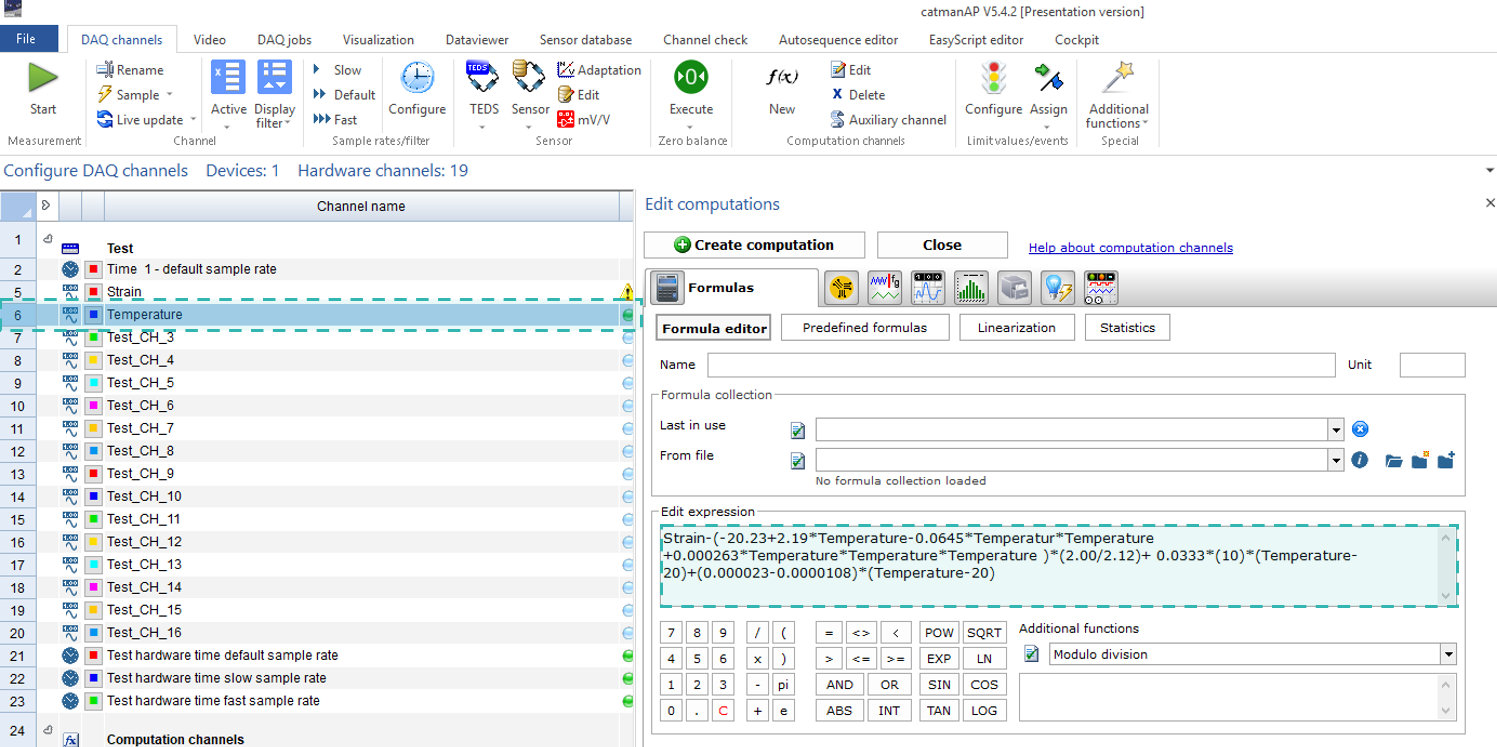
To establish this correction in catman DAQ software a new calculation channel needs to be created or an already existing calculation channel needs to be adapted. In this application example, the already existing computation channel needs to be adjusted by the updated thermal strain correction polynomial.
In chapter 2, the strain correction was performed via the polynomial and the gauge factor fitting. This is sufficient for most experimental tests. Nevertheless, the gauge factor (k-factor) additionally varies approximately linearly with temperature over a wide range. Therefore, a correction of the gauge factor can be considered in the uncorrected strain signal (not to be considered in the polynomial, since the temperature dependence of the gauge factor is already included in the polynomial). The temperature coefficient can be positive or negative, depending on the grid material (Constantan or CrNi (Modco).
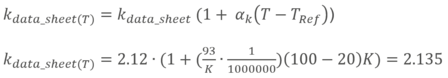
To easily calculate the temperature adjusted gauge factor, the HBK data sheet displays the temperature coefficient as well as the needed gauge factor (kdata_sheet = 2.12). Please check first, if the linear behaviour is valid even at extreme temperatures. In this case the temperature coefficient of the gauge factor is:
![]()
The correction formula of the gauge factor is as follows (T = 100 °C):
It is obvious that this effect is very small and might not be considered in the measurement since the effect is neglectable.
The temperature dependency of the gauge factor can be easily considered as part of the complete formula in catman DAQ software by adjusting the already existing computation channel.
Considering all effects described in this Tech Note, the formula for correcting the strain value is as follows:
| ε | Strain signal without any temperature correction |
| εs | Thermal output polynomial from strain gauge data sheet |
| εc | Strain value including thermal correction |
| εf | Mismatch correction of temperature coefficient |
| αR | Temperature coefficient of the gauge resistance [1/K] |
| αS | Temperature coefficient of the substrate/structure [1/K] |
| αM | Temperature coefficient of the strain gauge metal grid [1/K] |
| k | Gauge factor of the strain gauge |
| kdata_sheet | Gauge factor printed on the data sheet |
| kdata_sheet(T) | Gauge factor printed on the data sheet including temperature correction |
| kpolynomial | Gauge factor which was used to determine the polynomial (typically 2.00) |
| αk | Temperature coefficient of the gauge factor |
| a0 | a0 coefficient of polynomial |
| a1 | a1 coefficient of polynomial |
| a2 | a2 coefficient of polynomial |
| a3 | a3 coefficient of polynomial |
| ∆T | Temperature difference of temperature during strain measurement and reference temperature printed on strain gauge data sheet |
| Tref | Reference temperature printed on the strain gauge data sheet |
| αsubstrate | Temperature coefficient of material on which the strain gauge is applied |
| αstrain_gauge | Temperature coefficient of the strain gauge |
Legal Disclaimer: TECH NOTEs from HBK are designed to provide a quick overview to a specific topic beside the usual documentation. TECH NOTEs are continuously improved and so change frequently. HBM assumes no liability for the completeness of the descriptions. We reserve the right to make changes to the features and/or the descriptions at any time without prior notice.

This will bring together HBM, Brüel & Kjær, nCode, ReliaSoft, and Discom brands, helping you innovate faster for a cleaner, healthier, and more productive world.
This will bring together HBM, Brüel & Kjær, nCode, ReliaSoft, and Discom brands, helping you innovate faster for a cleaner, healthier, and more productive world.
This will bring together HBM, Brüel & Kjær, nCode, ReliaSoft, and Discom brands, helping you innovate faster for a cleaner, healthier, and more productive world.
This will bring together HBM, Brüel & Kjær, nCode, ReliaSoft, and Discom brands, helping you innovate faster for a cleaner, healthier, and more productive world.
This will bring together HBM, Brüel & Kjær, nCode, ReliaSoft, and Discom brands, helping you innovate faster for a cleaner, healthier, and more productive world.