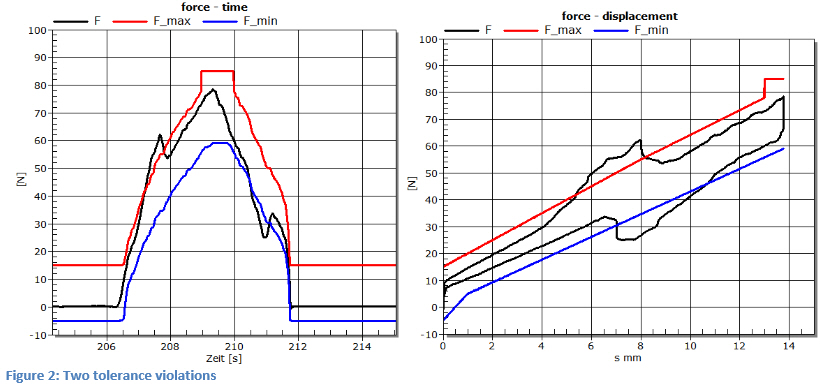
The measured force F is checked against an upper and a lower tolerance (F_max and F_min). Two value tables return tolerance values depending on the measured displacements. The diagram shows the force/time curve and the force/displacementcurve of a stroke movement with no violations of the tolerance limits.
Checking force against a tolerance band with PMX
During a stroke movement with measurement of force and displacement, the force is continuously checked against a tolerance band. The tolerance limits are defined according to displacement. A counter counts the tolerance violations and a digital output reports if the counter state is greater than zero. The counter state is automatically deleted at the beginning of each stroke movement.
(The necessary glyphs are available beginning with firmware version 1.34.)
Introduction

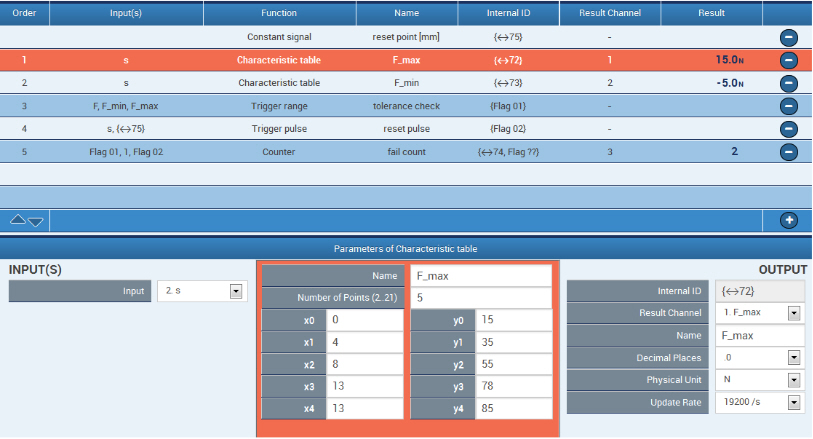
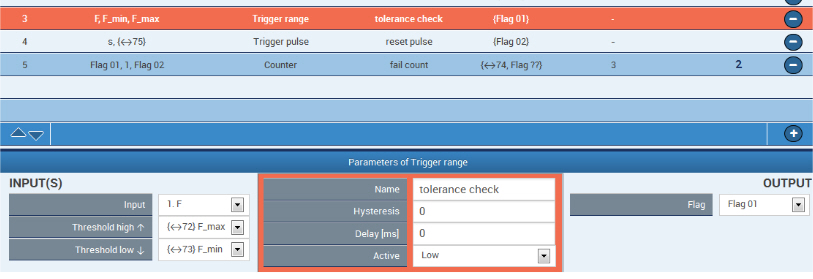
A "Trigger (range)" glyph compares force F with tolerances. A tolerance violation is indicated by Flag_01 and counted by a counter block.
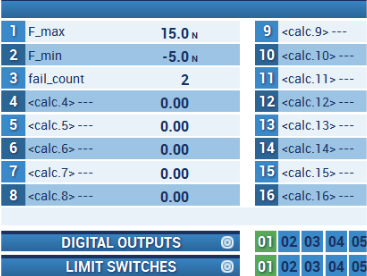
The overview after two tolerance violations. Digital output 01 indicates the error.
Procedure
The table for the upper tolerance line has five points on the displacement axis. The x values are the displacement in mm and the y values are the tolerance limit of the force in N.
Tip: Points with the same x values produce a jump in the characteristic curve, in this case at x3=x4=13.
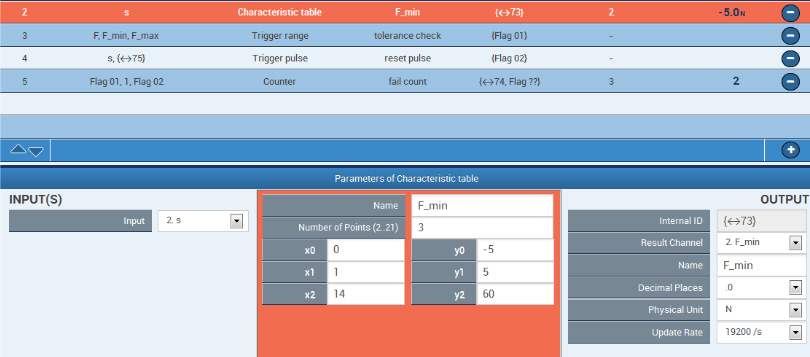
The table for the lower tolerance line:
The trigger block compares F with the tolerance limits. Output "Flag_01" is low within the tolerance.
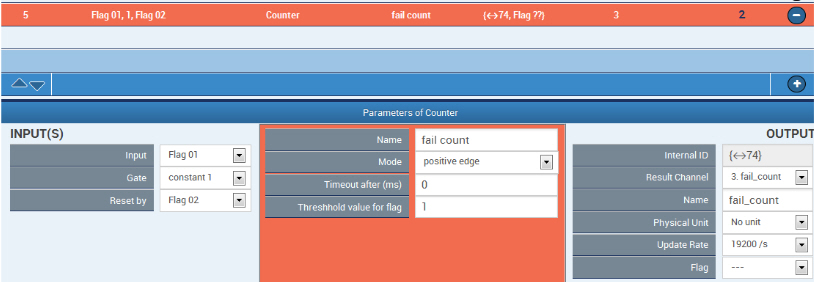
The counter block counts tolerance violations. It is deleted with Flag_02:
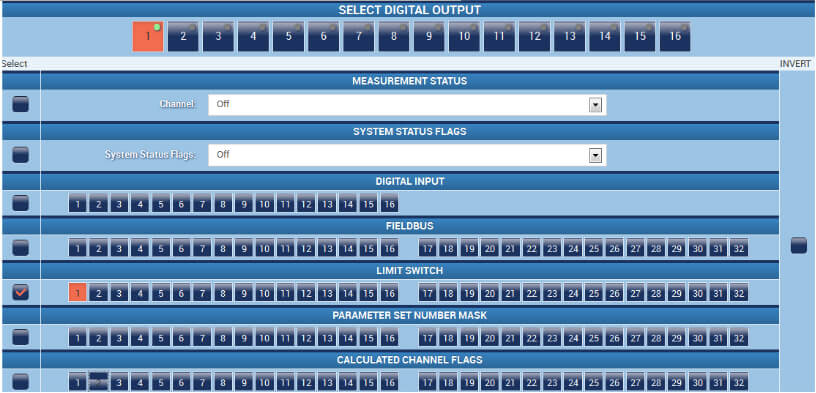
Limit switch No. 1 detects counter states >= 1:

Finally digital output No. 1 outputs the state of limit switch No. 1:
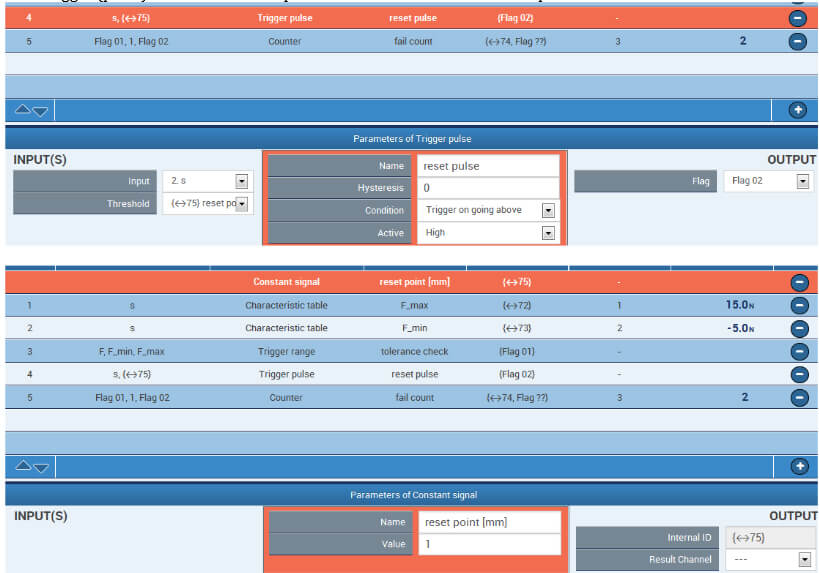
The "Trigger (pulse)" block returns the pulse to delete the counter if the displacement exceeds 1 mm
Disclaimer
These examples are simply for the purpose of illustration. They cannot be used as the basis for any warranty or liability claims.