Aug 29 2019
Learn the Essentials of Strain Gauge Measurement
Read More
This article addresses possible sources of error when strain gauges are used in experimental stress analysis and shows how to successfully assess measurement uncertainty already in the design stage
The aim of this article is to point out the many (often avoidable) sources of error when strain gauges are used in experimental stress analysis and to provide assistance so that measurement uncertainty can be assessed already in the design stage.
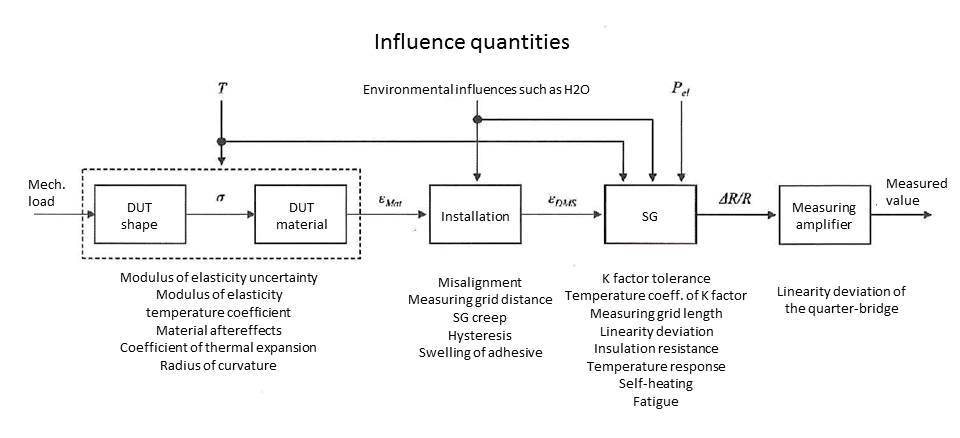
 The modulus of elasticity exhibits an uncertainty (tolerance of the modulus of elasticity). Extensive examinations on structural steels have shown a variation coefficient of 4.5%. The modulus of elasticity also depends on temperature as an influence quantity and the temperature coefficient of the modulus of elasticity.
If the strain gauge is glued to a surface (such as a bending rod) that is extended convexly, the strain on the measuring grid is greater than on the surface of the component.
The reason for this has to do with the distance from the neutral fiber: The further the measuring grid is from this neutral fiber and the thinner the component, the stronger the measured value becomes. Smaller roles are played by the thickness of the adhesive and the structure of the strain gauge. The change in temperature (∆t) acting together with the temperature coefficient of expansion of the material also causes thermal expansion, which is significant for zero-point related measurements.
Elastic after-effects (caused by relaxation processes in the microstructure of the material) cause the strain of the material to diminish somewhat after spontaneous loading. The formula in the chart exhibits several uncertainties.
The modulus of elasticity exhibits an uncertainty (tolerance of the modulus of elasticity). Extensive examinations on structural steels have shown a variation coefficient of 4.5%. The modulus of elasticity also depends on temperature as an influence quantity and the temperature coefficient of the modulus of elasticity.
If the strain gauge is glued to a surface (such as a bending rod) that is extended convexly, the strain on the measuring grid is greater than on the surface of the component.
The reason for this has to do with the distance from the neutral fiber: The further the measuring grid is from this neutral fiber and the thinner the component, the stronger the measured value becomes. Smaller roles are played by the thickness of the adhesive and the structure of the strain gauge. The change in temperature (∆t) acting together with the temperature coefficient of expansion of the material also causes thermal expansion, which is significant for zero-point related measurements.
Elastic after-effects (caused by relaxation processes in the microstructure of the material) cause the strain of the material to diminish somewhat after spontaneous loading. The formula in the chart exhibits several uncertainties.

 In actual practice, however, alignment and other installation errors occur despite great care. The strain gauge, as a spring element subject to mechanical stress, creeps back along its outer edge areas after spontaneous strain due to the strain loading and also depending on the rheological properties of the adhesive and the strain gauge carrier. It also exhibits a slight hysteresis the effect of the strain gauge creeping back is used in transducer construction to minimize material after-effects, which produce an undesirable additional strain, by adjusting the lengths of the transverse bridges not sensitive to strain on the strain gauge. This compensation can only be implemented in experimental stress analysis with a great deal of effort. Increased strain may also occur due to a curved installation surface (see above).
If measuring points are not adequately protected against humidity and moisture, the adhesive and carrier may soak up moisture and swell. This will be expressed as an error fraction in the form of an unintended task-specific strain in the strain gauges.
Moisture content also affects the stability of the measured values as in all methods of measurement (see below strain gauge: insulation resistance). Especially with zero-point related measurements, a test engineer may be uncertain whether he/she is observing the relevant material strain or whether it is simply one of the other effects described above. Because of this, measuring point protection is an essential precondition for reliable results, especially with zero-point related measurements.
This produces the effect that the strain of the measuring grid does not exactly match the material strain in the stress direction.
In actual practice, however, alignment and other installation errors occur despite great care. The strain gauge, as a spring element subject to mechanical stress, creeps back along its outer edge areas after spontaneous strain due to the strain loading and also depending on the rheological properties of the adhesive and the strain gauge carrier. It also exhibits a slight hysteresis the effect of the strain gauge creeping back is used in transducer construction to minimize material after-effects, which produce an undesirable additional strain, by adjusting the lengths of the transverse bridges not sensitive to strain on the strain gauge. This compensation can only be implemented in experimental stress analysis with a great deal of effort. Increased strain may also occur due to a curved installation surface (see above).
If measuring points are not adequately protected against humidity and moisture, the adhesive and carrier may soak up moisture and swell. This will be expressed as an error fraction in the form of an unintended task-specific strain in the strain gauges.
Moisture content also affects the stability of the measured values as in all methods of measurement (see below strain gauge: insulation resistance). Especially with zero-point related measurements, a test engineer may be uncertain whether he/she is observing the relevant material strain or whether it is simply one of the other effects described above. Because of this, measuring point protection is an essential precondition for reliable results, especially with zero-point related measurements.
This produces the effect that the strain of the measuring grid does not exactly match the material strain in the stress direction.
 The tolerance of the K factor and its temperature sensitivity contribute to the uncertainty.
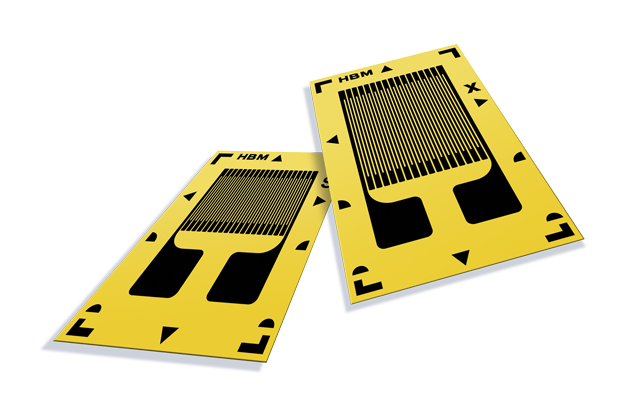
It should be noted that if the strain is not distributed homogeneously, the average of the strain under the measuring grid is converted into the relative change in resistance. As a result of this, if the wrong active length of the strain gauge is chosen, the values measured for strain and material stress will be too small or too large. This is especially important when determining the maximum values of the mechanical stress peaks metrologically.
The temperature response of the strain gauge affects the zero point. It has an impact with large temperature differences and especially with strain gauges that are poorly adapted to the thermal expansion coefficient of the material (DUT), since they interfere with the action of the compensation effects.
Self-heating (due to electrical power transformed in the strain gauge) has a similar result, as it leads to a temperature difference between the material and the strain gauge. This is the reason why it is possible to set very low excitation voltages on modern measuring amplifiers. Even small bridge output voltages can be accurately amplified by the devices. Caution is advised, however, with thin materials and materials that dissipate heat poorly.
In the case of frequent alternating strain with a large amplitude (> 1500 µm/m) fatigue may occur in the measuring grid material, resulting in a zero drift.
A transverse sensitivity of the strain gauge is present, but it does not produce any significant deviations. In the uniaxial stress state the transverse sensitivity is taken into consideration by the experimental determination of the K factor due to the way the factor is defined.
A linearity deviation of up to 1000 µm/m is negligible for strains.
Penetration of moisture and humidity reduces the insulation resistances, which in turn causes a resistance shunt to the connections of the strain gauge and is generally reflected by instability in the display of measured values. Low-ohm strain gauges are less sensitive to the influence of moisture and humidity.
The tolerance of the K factor and its temperature sensitivity contribute to the uncertainty.
It should be noted that if the strain is not distributed homogeneously, the average of the strain under the measuring grid is converted into the relative change in resistance. As a result of this, if the wrong active length of the strain gauge is chosen, the values measured for strain and material stress will be too small or too large. This is especially important when determining the maximum values of the mechanical stress peaks metrologically.
The temperature response of the strain gauge affects the zero point. It has an impact with large temperature differences and especially with strain gauges that are poorly adapted to the thermal expansion coefficient of the material (DUT), since they interfere with the action of the compensation effects.
Self-heating (due to electrical power transformed in the strain gauge) has a similar result, as it leads to a temperature difference between the material and the strain gauge. This is the reason why it is possible to set very low excitation voltages on modern measuring amplifiers. Even small bridge output voltages can be accurately amplified by the devices. Caution is advised, however, with thin materials and materials that dissipate heat poorly.
In the case of frequent alternating strain with a large amplitude (> 1500 µm/m) fatigue may occur in the measuring grid material, resulting in a zero drift.
A transverse sensitivity of the strain gauge is present, but it does not produce any significant deviations. In the uniaxial stress state the transverse sensitivity is taken into consideration by the experimental determination of the K factor due to the way the factor is defined.
A linearity deviation of up to 1000 µm/m is negligible for strains.
Penetration of moisture and humidity reduces the insulation resistances, which in turn causes a resistance shunt to the connections of the strain gauge and is generally reflected by instability in the display of measured values. Low-ohm strain gauges are less sensitive to the influence of moisture and humidity.
 The actual correlation exhibits a small degree of non-linearity, which will be examined in greater detail below.
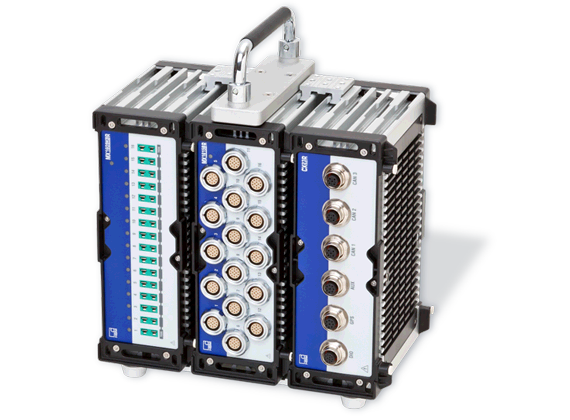
The measuring amplifier supplies voltage to the bridge circuit, amplifies the bridge output voltage and generates the measured value.
Deliberately left out of consideration here are measurement errors that can occur due to long supply lead resistances, interference fields, thermoelectric voltages and the measurement electronics themselves.
These can be almost entirely avoided by using well-known technologies (multiwire techniques, extended Kreuzer circuits, shielding designs, modern TF measuring amplifiers).
The actual correlation exhibits a small degree of non-linearity, which will be examined in greater detail below.
The measuring amplifier supplies voltage to the bridge circuit, amplifies the bridge output voltage and generates the measured value.
Deliberately left out of consideration here are measurement errors that can occur due to long supply lead resistances, interference fields, thermoelectric voltages and the measurement electronics themselves.
These can be almost entirely avoided by using well-known technologies (multiwire techniques, extended Kreuzer circuits, shielding designs, modern TF measuring amplifiers).

 This means that if the material has a modulus of elasticity with a value known within an uncertainty of 5%, that alone produces an uncertainty of 5% in the stated mechanical stress.
 This is equivalent to the additional uncertainty of the mechanical stress.
 Example: If the modulus of elasticity of steel is given for a temperature of 23 °C and the measurement is performed at 33 °C, the modulus of elasticity drops by 0.2%. If this effect is not compensated for by computations, there will be a deviation of 0.2% in addition to the tolerance specified for the modulus of elasticity. Note that the TC of the modulus of elasticity is itself temperature-dependent, which means that this effect can never be entirely compensated for.


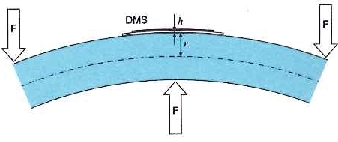
 For a medium distance of 100 μm from the measuring grid to the component surface and a bending radius of 100 mm, the resulting increase in strain is 1/1000 relative to the current strain value. The actual strain of the component in this example is 0.1% lower than the measured strain. That means that the stress is measured 0.1% too large. This measurement error is clearly only relevant for small bending radii.
 An alignment error of 5 degrees and a Poisson's ratio of 0.3 (steel) results in a strain error of -1%. Thus, the actual strain and the material strain are 1% greater.
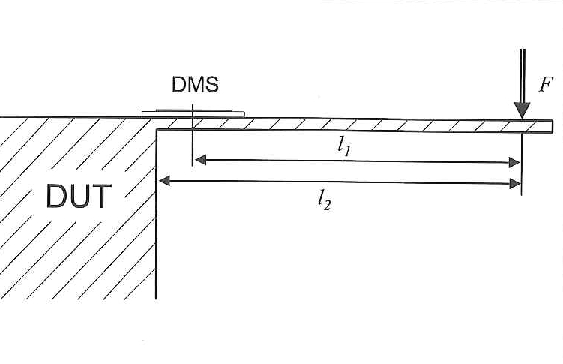
 The maximum stress value that is actually wanted could easily be determined in this simple case with a correction calculation. If this is not done, a deviation of the measurement result from the maximum stress will be produced.
Its relative deviation is:
The maximum stress value that is actually wanted could easily be determined in this simple case with a correction calculation. If this is not done, a deviation of the measurement result from the maximum stress will be produced.
Its relative deviation is:
 If a measuring grid with an active length of less than 2% of l2 is used in the example above, the deviation drops to less than 1% of the measured value.
Ultimately the ratio of the maximum strain and the measured strain always depends on the distribution of strain under the measuring grid. If this is known from a Finite Element Calculation, the desired maximum value can be calculated from the arithmetic mean of the stress.
Of course, deviations will occur if the strain gauge is positioned incorrectly. This can also be largely avoided and it must be.
If a measuring grid with an active length of less than 2% of l2 is used in the example above, the deviation drops to less than 1% of the measured value.
Ultimately the ratio of the maximum strain and the measured strain always depends on the distribution of strain under the measuring grid. If this is known from a Finite Element Calculation, the desired maximum value can be calculated from the arithmetic mean of the stress.
Of course, deviations will occur if the strain gauge is positioned incorrectly. This can also be largely avoided and it must be.

 If the strains were determined with the relationship
 there would be no linearity deviations at all. However, as the quadratic component is simply neglected in practical applications, the resulting error should be indicated here. The relative deviation of the determined strain value from the true value is as large as the strain itself:
 For strains up to 1000 μm/m, the value of the relative strain deviation does not exceed 0.1%. This is equivalent to 1 μm/m, which is negligible.
Linearity deviation only becomes appreciable at greater strains:
10,000 μm/m results in 1%
For strains up to 1000 μm/m, the value of the relative strain deviation does not exceed 0.1%. This is equivalent to 1 μm/m, which is negligible.
Linearity deviation only becomes appreciable at greater strains:
10,000 μm/m results in 1% Although the relationship is non-linear, linearity is assumed in practical measurement applications (whether or not this is known) and the approximation equation
 is used. The relative deviation resulting from this simplification can be calculated with eq.
 A strain of 1000 μm/m (with k = 2) results in a change of 0.2% in the relative resistance.
The relative measurement error as determined with eq. 17 is -0.1%. This is equivalent to an absolute deviation of -1 μm/m. The deviation from the true value is negligible.
Appreciable linearity deviations occur at greater strains however, as noted above:
10,000 μm/m results in a deviation of -1%,
A strain of 1000 μm/m (with k = 2) results in a change of 0.2% in the relative resistance.
The relative measurement error as determined with eq. 17 is -0.1%. This is equivalent to an absolute deviation of -1 μm/m. The deviation from the true value is negligible.
Appreciable linearity deviations occur at greater strains however, as noted above:
10,000 μm/m results in a deviation of -1%, 
 Self-heating
 For a root mean square value of 5 V for the bridge excitation voltage and a 120 Ω strain gauge the resulting heat output is 52 mW. A strain gauge with a measuring grid length of 6 mm applied with a thin layer of adhesive on steel or aluminum is able to give off the heat sufficiently to the measurement object. A small temperature difference will nevertheless arise between the strain gauge and measurement object, which will lead to an apparent strain (see above):
 If the temperature of the adjusted strain gauge is just one Kelvin above the material temperature, there is already an apparent strain of -11 μm/m (ferritic steel) or -23 μm/m (aluminum). The measurement uncertainty can be roughly determined with a simple experiment - the excitation voltage is connected while the load is not applied to the component. In the temperature increase phase, the measured value will drift slightly (zero drift). The greatest difference between measured values during this thermal compensating process corresponds roughly to the maximum expected deviation.
Lower excitation voltages provide a remedy (1 V generates only 2 mW). Strain gauges with higher resistances are also advantageous in this respect.
For components with poor heat conductance (plastics, etc.) and when very small strain gauges are used, lowering the excitation voltage is indispensable. Caution is always advised when working with rapidly changing temperatures. Compensation effects resulting from adjusting the metal foil of the strain gauge to the material being examined have a time constant.
If the temperature of the adjusted strain gauge is just one Kelvin above the material temperature, there is already an apparent strain of -11 μm/m (ferritic steel) or -23 μm/m (aluminum). The measurement uncertainty can be roughly determined with a simple experiment - the excitation voltage is connected while the load is not applied to the component. In the temperature increase phase, the measured value will drift slightly (zero drift). The greatest difference between measured values during this thermal compensating process corresponds roughly to the maximum expected deviation.
Lower excitation voltages provide a remedy (1 V generates only 2 mW). Strain gauges with higher resistances are also advantageous in this respect.
For components with poor heat conductance (plastics, etc.) and when very small strain gauges are used, lowering the excitation voltage is indispensable. Caution is always advised when working with rapidly changing temperatures. Compensation effects resulting from adjusting the metal foil of the strain gauge to the material being examined have a time constant.
 This eq. shows that the effect is lower with high-resistance strain gauges. The following measurement errors are determined for 120 Ω strain gauges (gauge factor = 2):
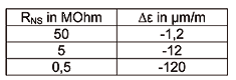 Under “normal” circumstances, insulation resistances greater than 50 MΩ can be achieved and the deviations of less than 1.2 μm/m are negligible.
At 500 kΩ and with a measured value of 1000 μm/m. the zero error would already be -12%! This shows clearly that a significant drop in insulation resistances could cause the measuring point to fail. Strain gauge transducers have insulation resistances of several GΩ.
A high relative humidity with high temperature at the same time (such as saturated vapor) is critical because it leads to a high water vapor pressure. The tiny water molecules push forward and gradually overcome the measuring point protection. It is impossible to predict without a test whether the measuring point will fail after just a few days or several years.
Under “normal” circumstances, insulation resistances greater than 50 MΩ can be achieved and the deviations of less than 1.2 μm/m are negligible.
At 500 kΩ and with a measured value of 1000 μm/m. the zero error would already be -12%! This shows clearly that a significant drop in insulation resistances could cause the measuring point to fail. Strain gauge transducers have insulation resistances of several GΩ.
A high relative humidity with high temperature at the same time (such as saturated vapor) is critical because it leads to a high water vapor pressure. The tiny water molecules push forward and gradually overcome the measuring point protection. It is impossible to predict without a test whether the measuring point will fail after just a few days or several years.
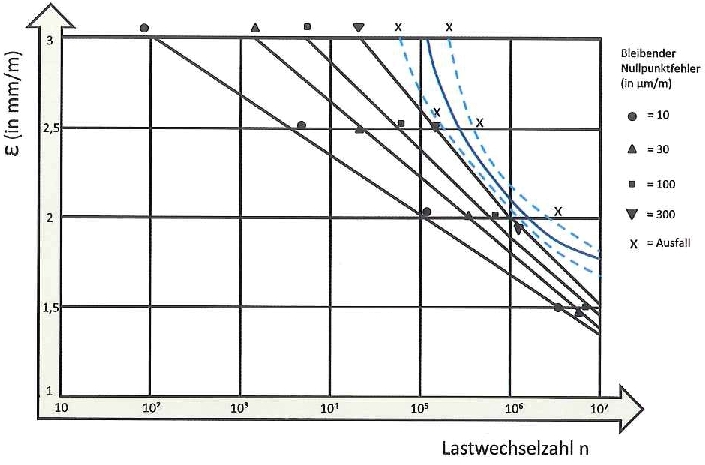
Signs of fatigue in the strain gauge measuring grid appear during dynamic loading of the component that are expressed in a zero drift (apparent strain in the material). The greater the alternating strain amplitude and the greater the number of load cycles, the greater the effect (Fig. 5).
The installation and the arithmetic mean of the strain also affect the zero drift. If the average is negative, the fatigue life improves. If the value is positive, it deteriorates. Practically no zero drift may be expected for alternating strains with an amplitude up to 1000 μm/m. Greater amplitudes are more critical. A zero error of 10 μm/m may be expected for:
1500 μm/m and approx. 2 mil. load cycles
2000 μm/m and approx. 100,000 load cycles
2500 μm/m and approx. 4000 load cycles
3000 μm/m and approx. 100 load cycles
Note that the test specimen also undergoes fatigue. If its resistance to alternating loads is greater than that of the foil strain gauge, use of optical strain gauges should be considered (fiber Bragg grating).
 the value is comparable to those in part 3.
If the values in bold type above are combined using Pythagorean addition, the result is 16.01 μm/m. Since measurement uncertainties should not be rounded, the uncertainty for the zero point is 17 μm/m. With a strain of 1000 μm/m, the deviation expressed as a percentage is 1.7%, which is certainly reasonable. It is clearly critical with small strains: 17 μm/m of 100 μm/m is already 17%.
Now the uncertainty of the zero point (1.7% or 17%) must still be added to the uncertainty from part 3 (3% for the strain measurement).
The result of Pythagorean addition is:
4% with a measured value of 1000 μm/m,
the value is comparable to those in part 3.
If the values in bold type above are combined using Pythagorean addition, the result is 16.01 μm/m. Since measurement uncertainties should not be rounded, the uncertainty for the zero point is 17 μm/m. With a strain of 1000 μm/m, the deviation expressed as a percentage is 1.7%, which is certainly reasonable. It is clearly critical with small strains: 17 μm/m of 100 μm/m is already 17%.
Now the uncertainty of the zero point (1.7% or 17%) must still be added to the uncertainty from part 3 (3% for the strain measurement).
The result of Pythagorean addition is:
4% with a measured value of 1000 μm/m,

This will bring together HBM, Brüel & Kjær, nCode, ReliaSoft, and Discom brands, helping you innovate faster for a cleaner, healthier, and more productive world.
This will bring together HBM, Brüel & Kjær, nCode, ReliaSoft, and Discom brands, helping you innovate faster for a cleaner, healthier, and more productive world.
This will bring together HBM, Brüel & Kjær, nCode, ReliaSoft, and Discom brands, helping you innovate faster for a cleaner, healthier, and more productive world.
This will bring together HBM, Brüel & Kjær, nCode, ReliaSoft, and Discom brands, helping you innovate faster for a cleaner, healthier, and more productive world.
This will bring together HBM, Brüel & Kjær, nCode, ReliaSoft, and Discom brands, helping you innovate faster for a cleaner, healthier, and more productive world.