For visualization in Codesys „Login“ and start the program. The Visualisation tab shows the following overview.
CODESYS application – PMX Web visualisation
This is a quick start guide to starting CODESYS applications for PMX. Basic experience with CODESYS is assumed. Experienced users are free to adopt a different approach. Further help is available from the examples that are installed as standard on the desktop when the PMX package is installed and from the online Help for the package. The necessary files are found on the "PMX CODESYS" CD that is included in the scope of supply of every PMX containing CODESYS or can be downloaded from the support page at hbm.com.
In this example, a Web visualisation for PMX is created. A measured value is displayed graphically and numerically and a limit value is displayed if exceeded. The measured value can be reset via a button. Various parameter sets in the PMX can be activated via a drop-down menu.
Create Codesys project
- Open Codesys development software
- Select
 under the “Basic Operations“button, enter a name for the project and confirm with “ok”.
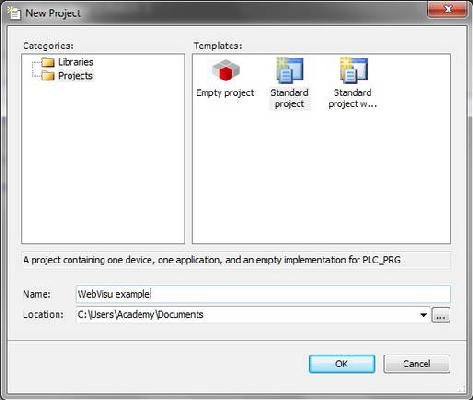
- Select the PMX system in the window „Standard Project“ which opens up.
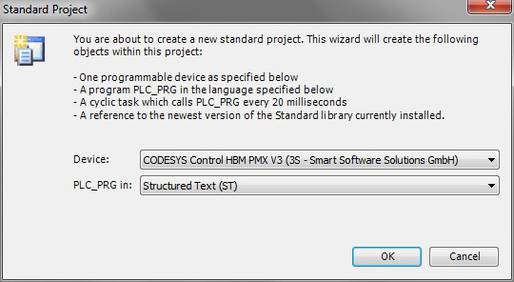
- This selection will lead to the following overview screen
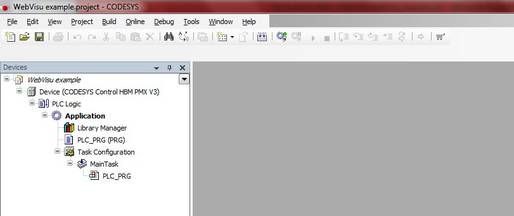
Add visualisation
- Right-click on „Application“ and select „Add Object“ and „Visualization“
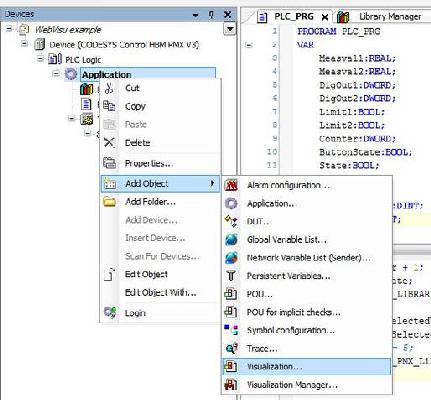
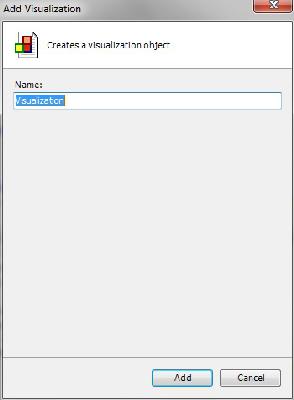
- The overview will look like this
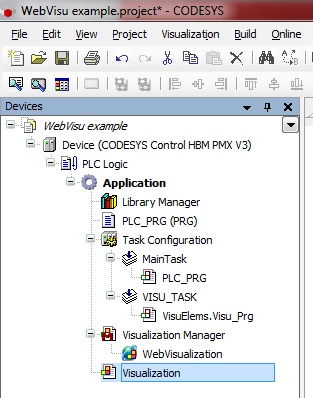
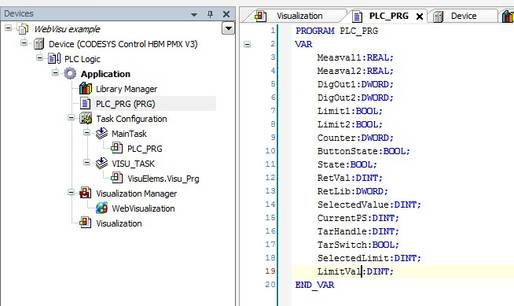
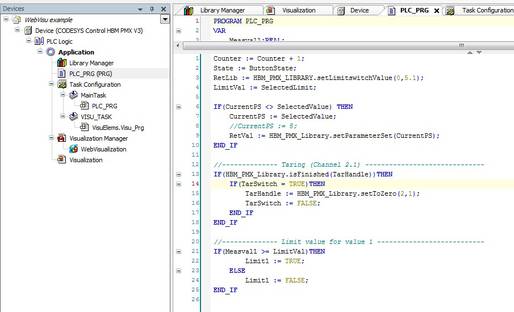
Declare variables under PLC_PRG
- In the section „PLC_PRG“ declare the variables as shown below
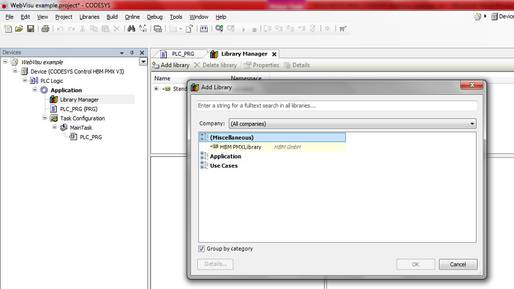
- Add the HBM PMX Library (in the Library Manager)
Write program
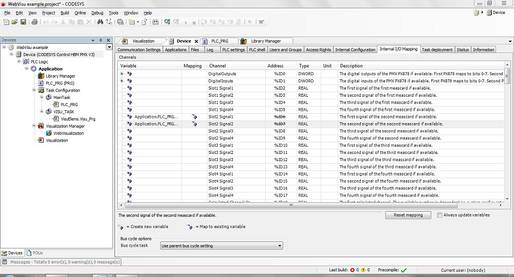
In the tab “Internal I/O Mapping“, map the variables to the slots used. Please note: Activate the ”Always update variables“ checkbox
Add visualisation objects and visualisation
The „toolbox“ on the right-hand side of the screen offers the elements to create any visualisation which can be included by „Drag and Drop“.
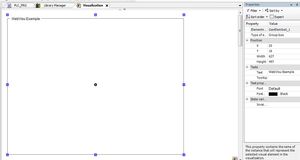
a) Groupbox element
b) Trace
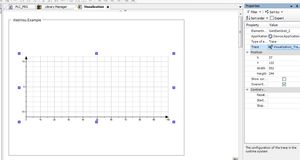
Add a task to the Trace
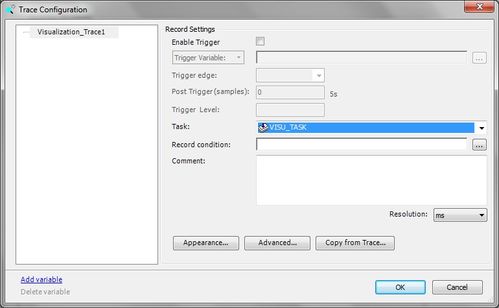
Add individual variables
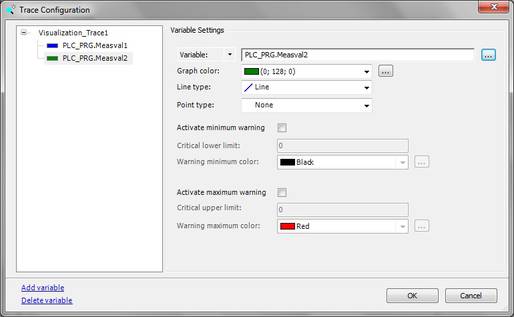
c) Add a bardisplay and adjust the scale according to your requirements
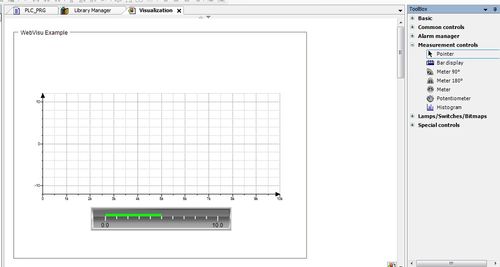
Measval 2 can be mapped to the value

d) Add a button and name it
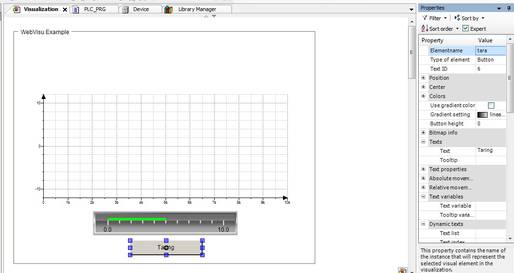
A task can be added to the button

e) Add a power switch. And select a matching variable (in this case: ButtonState)
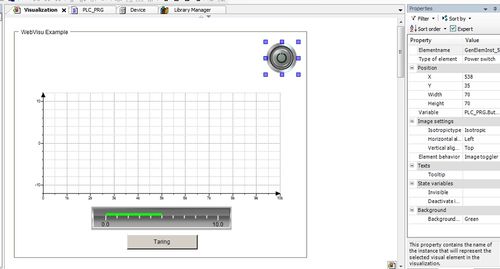
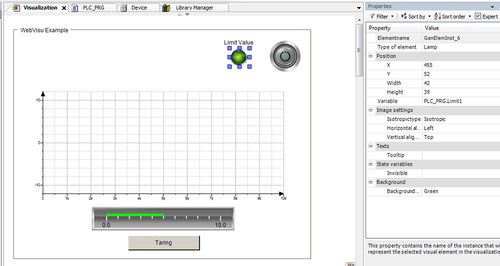
f) Add lamp and assign variable (in this case: Limit1). Labelling the lamp with its function is optional
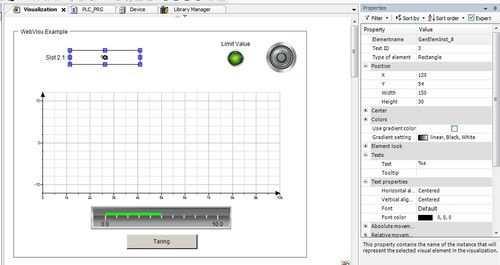
g) Add a rectangle and assign variable. Add text = „%s“ and label
h) Add a text field and the Text „%s“
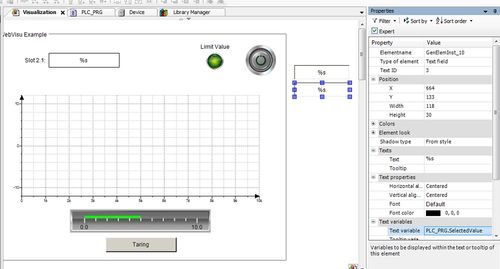
Declare text variables, make sure to set the “Filter“ to “All categories“, otherwise the “Text variable” menu item will not be displayed with the properties.
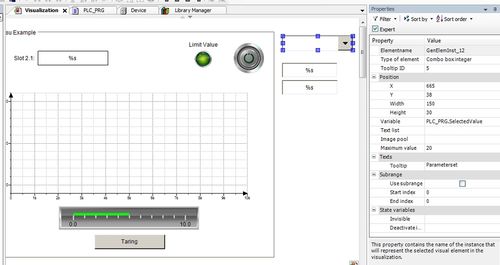
i) Add Combobox integer and choose corresponding variable (in this case: SelectedValue)
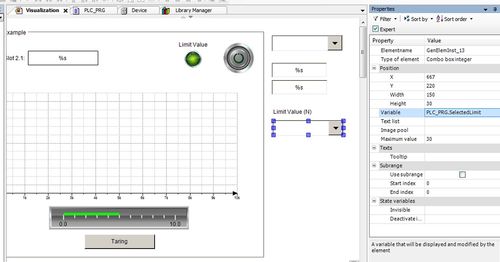
j) Add Combobox integer which is used to set the Limit value in the program afterwards
Start visualisation in the Web browser
- Open the PMX in the browser and load the Visualisation by clicking on the Codesys button on the lower left-hand side.

- The visualisation will be displayed in a new tab.
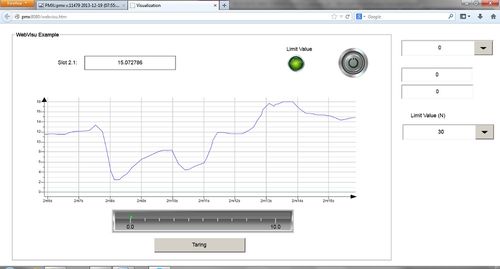
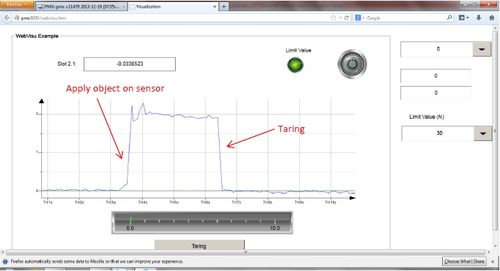
- When the measured value exceeds the limit the lamp will light up:
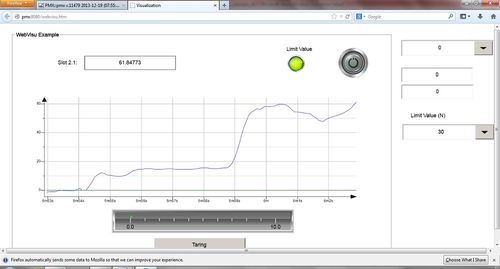
- The Taring button resets the starting point
TIP
Further information and help with creating Codesys programs is available from the Codesys online Help, on the Internet at or in the Codesys chat room.
Benefit from the knowledge and information available in the Codesys Store. You'll find many examples of programs and solutions there, covering a wide range of tasks.
Disclaimer
These examples are for illustrative purposes only. They cannot be used as the basis for any warranty or liability claims.
