Mechanical Battery Testing Using Force Sensors Mechanical Battery Testing Using Force Sensors | HBM

Mechanical Battery Testing Using Force Sensors

1 Motivation

Batteries as power sources for motor vehicles are based on lithium-ion systems with the lithium-ion cells generally having anodes made of graphite. During the charging process, lithium ions are stored in the graphite, resulting in a volume increase.

In 2014, Florian Grimsmann [1] described a method that enables a change in the cell thickness to be measured during the charging and discharging processes. He also successfully measured the changes in the dimensions of battery cells due to irreversible changes in thickness (lithium-plating) at very low temperatures or high charging currents.

Charging and discharging of lithium-ion accumulators thus results in reversible and irreversible mechanical effects. Besides the measurement of changes in the dimensions of the cells, the measurement of the forces resulting from the charging and discharging cycles and the effect of lithium-plating has recently become the focus.

Reliable sensors that work safely even under unfavourable climatic conditions are available to reliably measure these forces – even over very long periods. The cell under test is arranged in series with the force transducer.

2 Basic conditions of battery tests

Mechanical testing of batteries often takes place under precisely set temperature conditions. Temperatures of less than 0 °C or 80 °C can also be achieved in the climatic chambers.

Aside from the force, heat is also generated in the cells during the charging and discharging cycles, therefore, the effect of a temperature gradient on the force transducer is to be expected since it is in direct mechanical contact with the test specimens. The tests may run for a very long time, without the possibility of zero-balancing the measuring chain. Small changes in force must be reliably detected, making a low measurement uncertainty important.

Other measured variables, such as current and voltage on the electrical side and the measurement of displacement (deformation of the cells) are usually recorded as well. The temperature information is also significant.

The typical mechanical setup consists of a force frame. The cell under test is generally mechanically connected to a force transducer to allow for force measurement. High demands need to be placed on the stiffness of the frame. An example setup is shown in the figure below.

3 Radially-symmetric shear-force transducers (HBK series U10M and C10)

Using the example of a U10M, the measuring body of a radially-symmetric shear-force transducer is shown in a photo and as an FEM model in Figure 2.

Force is introduced into the U10M’s inner central thread [1] and transmitted to the outer flange [3] via the links [2]. This outer flange is either screwed onto an adapter or mounted directly onto a construction element (Fig. 1).


The application of force results in mechanical stress to the links, which in turn results in strain. The strain gauges are installed at an angle of 45 degrees to measure strain resulting from shear stress. The field of strain is shown in the diagram in Figure 4. It does not matter where the strain occurs in the area of the measuring grid, which is beneficial to the use of strain gauges.

There are no distinct strain maximums, as known from other measuring body principles. Damage to strain gauges occurs due to the highest strain. The field of strain, which can be obtained according to the shear-force principle, is therefore particularly favourable.

The FEM model shows that, when force is applied, deformation occurs only in the areas where the strain gauges are installed (Fig. 2 right-hand figure) – all other mechanical stresses are lower. Higher strains are indicated by the colour red, with blue indicating no or little mechanical stress. As can be seen, deformations are concentrated on the area where the strain gauges are installed. Overall, the deformation under load is very small. Since the stiffness is obtained from the ratio of force and displacement (i.e., deformation under force), radially-symmetric shear-force transducers attain very high stiffness, or, in other words, minimal deformation under load.

HBK uses only chromium-nickel strain gauges in these force transducers, instead of the usual Constantan strain gauges. Constantan offers cost advantages; however, chromium-nickel material has the benefit of higher sensitivity and significantly better freedom from drift. The force sensor’s zero point remains very stable for a long time.

The increased sensitivity and favourable field of strain allow very high output signals of over 4 mV/V for many models and, thus, a low relative influence of temperature and drift.

The design allows the welding of the sensor. This hermetically seals and grants it extremely good stability in terms of its metrological properties.

HBK has performed complex internal tests to prove the sensors’ stability, and it has been shown that the typical drift of the zero point is approximately 200 ppm (of the full-scale value) over 700 hours. After a switch-on drift, the force transducers show an extremely small change in the zero signal even at increased temperatures which, in turn, allows unadulterated force measurements (see fig. 5).

4 Requirements on the force transducer/Why use shear-force transducers in this application?

As described above, tests are run over a long time under demanding conditions. The requirement profile is as follows:

  • High sensor stiffness
  • Low drift of the zero point even over long test periods and at increased temperatures
  • Insensitive to temperature gradients
  • Hermetically sealed to minimise environmental influences (e.g., due to condensation)
  • Excellent accuracy even with minimal force variations

The C10 radially-symmetric shear-force transducer meets all these requirements

Stiffness: Shear-force sensors have a very small displacement to ensure that the influence of the sensor on the result is smaller than the influence of the remaining setup.

Low drift: The C10 transducers have an output signal of 4 mV/V, thus, the influence of the drift is small because the drift influence is to be assessed relative to the full-scale value. Furthermore, the strain gauges are based on CrNi and can, therefore, be particularly well stabilised which results in excellent zero-point stability. A targeted report that will help estimate the drift for a year can be provided on request.

Insensitive to temperature gradients: Shear-force sensors from HBK, i.e., U10 and C10, are equipped with eight strain gauges per bridge. These strain gauges are installed on four shear beams (positions 1–4 in Fig. 6). Two strain gauges are always installed opposite each other, one measuring positive and the other one the negative strain. The advantage is that the influence of the temperature on each link is compensated for to ascertain that the sensor is highly insensitive to temperature gradients.

Hermetic sealing is guaranteed, as all C10 with nominal forces greater than 10 kN are welded and achieve IP68 with the "permanently integrated cable" option and work stably even if affected by high levels of humidity. With accuracy classes of 0.02 or 0.05, C10 are among the most precise force transducers in their class.

5 Assessment of measurement uncertainty

A test with a C10 under constant temperature conditions of 40 °C over 500 days shall be considered below.

Please note the following sensor parameters:

Hysteresis: 0.04 % of Fnom

Linearity: 0.035 % of Fnom 

Sensitivity error: 0.1 % of the reading, with adjusted nominal rated output

Temperature coefficient of the zero point: 0.0750 %/10 K

Temperature coefficient of sensitivity: 0.015 %/10 K

Drift/year: According to HBK-internal investigations, 0.1 %/year

Relative creep over 30 minutes: 0.02% of the reading

Ambient conditions

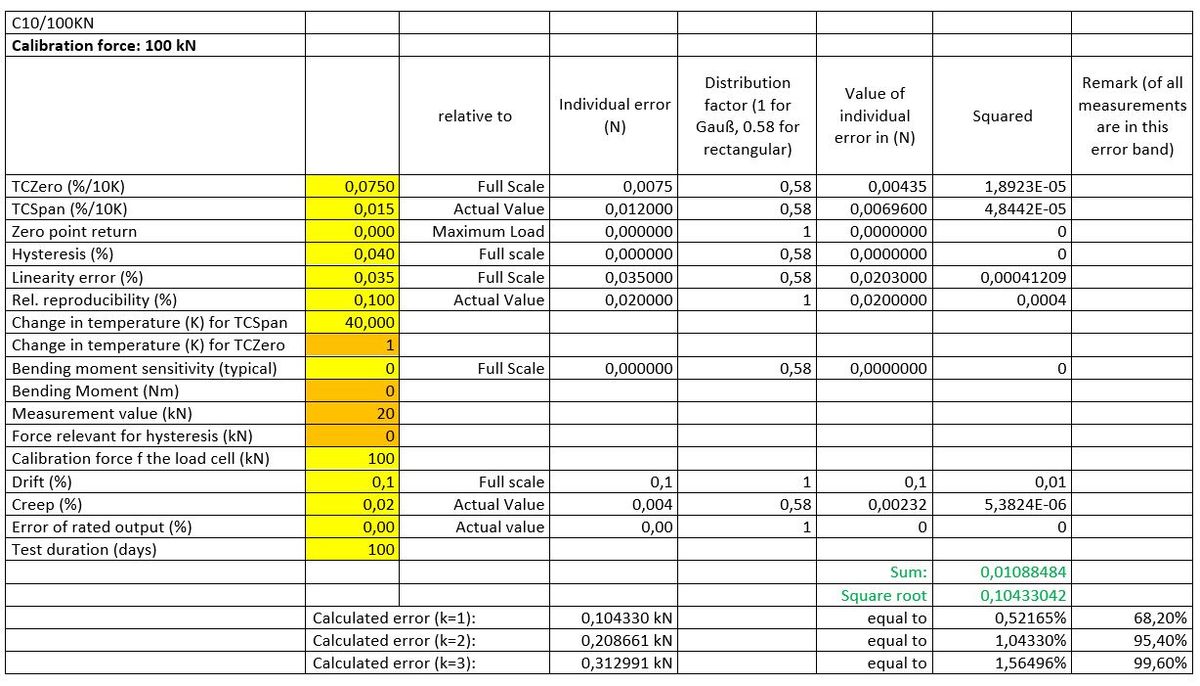
Temperature conditions:

  • Temperature difference to the reference value: 40 °C (for TCC)
  • Temperature stability: 1 °C (for TCzero)

Force application:

  • Central introduction of force with very low tolerance

Let’s assume a scenario with a force response that increases linearly over the test run, starting with forces of about 100 N up to forces of 100 kN. A C10/100KN force transducer from HBK is used.

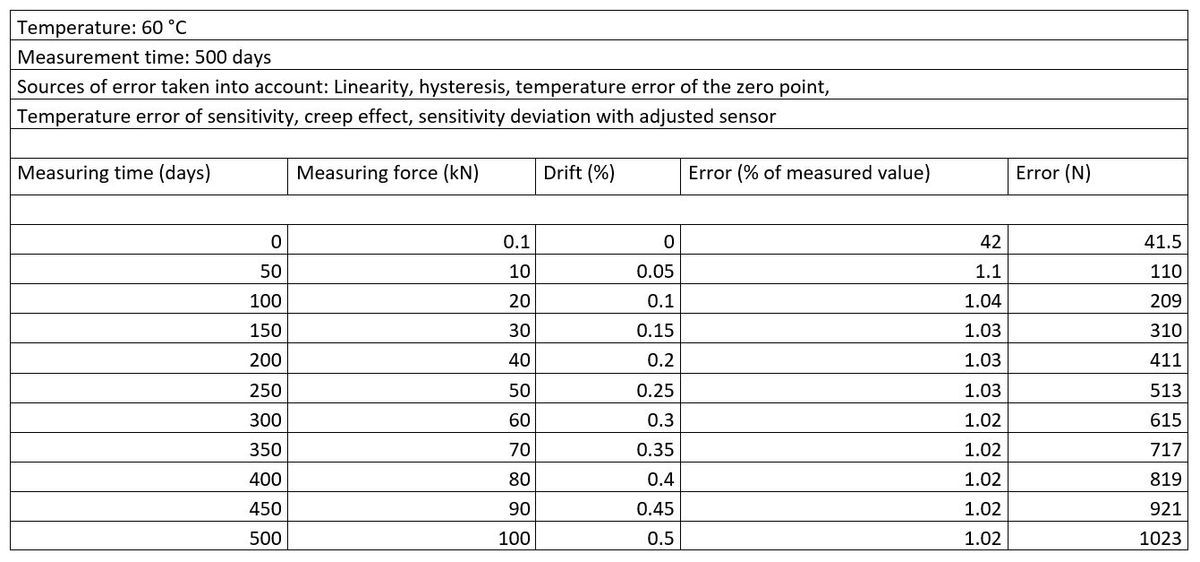
It is, therefore, necessary to calculate the error at different points over the time-force response. To keep the model simple, we assumed a linear increase in force (0 N on the first day, 100 kN after 500 days).

The relevant individual errors were documented in the table shown in Figure 7.

The result for the hundredth day is shown as an example, with a force of approximately 20 kN.

This calculation can now be repeated for all of the measuring points. The result is presented in the table below (see fig. 8). Notably, a measurement error of about 1 % relative to the measured value can be achieved even under these difficult measuring conditions. This applies to the absolute force value. Force variations (e.g., from charging cycle to charging cycle) can be detected with higher accuracy.

On the one hand, the measurement uncertainty increases because the drift due to physical reasons has to be taken into account. On the other, the force increases, so that the relative influence on the measuring signal becomes smaller under the conditions selected here.

6 Conclusion

For long-term measurements of forces on batteries, high demands must be placed on the sensor as failure of the force transducer during the long test periods can delay projects and cause considerable costs. Hermetically sealed shear-force sensors – such as the C10 from HBK with a high output signal and very high accuracy – are available and fulfil the specified requirements safely.

Want to find out more?

Watch the webinar recording on mechanical battery testing: Physical single cell testing

The session focuses on force measurement as a tool to understand battery aging and physical changes. It's about the detection of even the smallest changes in force to find out about:

  • Effects of charge and discharge
  • Influences on the measurement
  • Measurement uncertainty

Or refer to the other presentations from the battery testing webinar series.


Sources

[1] „Auswirkungen des Ladeprofils auf das Lithium-Plating-Verhalten von Lithium-Ionen-Zellen“, Florian Grimsmann, master thesis, Carl von Ossietzky University, Oldenburg, Germany, p 19 ff