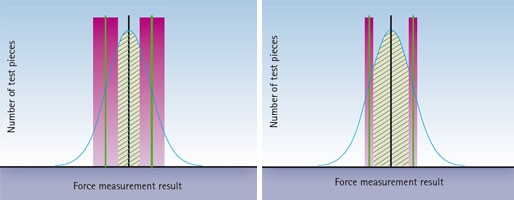
Precise force transducers such as S2M positively affect both the field of application that is expanded and the efficiency of manufacturing processes, which is illustrated in fig. 1.
The force to be measured for quality control purposes is shown on the X axis. The number of produced parts is indicated on the Y axis.
The scattering of the produced parts is distributed according to the Gaussian bell curve law. Green lines, indicating the permissible tolerances, are entered in the diagrams, and the measurement uncertainty of the force measurement chain can be seen to the left and right of these limits in red.
The transducer's measurement accuracy needs to be assessed to enable the process to be evaluated. To implement a good/bad evaluation, the components may only be evaluated as OK when they lie within the set-point range less the measurement tolerance - shown in the diagrams by the blue hatched lines.
It becomes obvious that the number of parts that can be tolerated increases with increasing measurement accuracy. In other words: The number of parts to be rejected is also dependent on the force measurement chain's measurement accuracy.