Correlating AE Spikes with Deformations of Sand Grains
In our experiments, we acquired AE data using a Genesis HighSpeed portable data recorder from HBM. The company provides solutions for test and measurement applications such as sensors, transducers, strain gages, amplifiers, data recorders and data acquisition systems (DAQ), as well as software for structural durability analysis.
We first put sand into a hollow cylinder and placed an acoustic emission sensor (a piezoelectric-based device that transforms the pressure wave into an electrical signal) at the boundary of the material. The AE sensor was attached to a charge amplifier, which output a voltage that was fed to the Genesis.
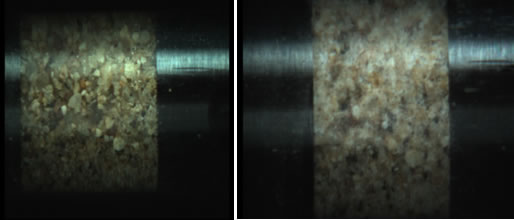
To replicate blast forces, we used a cylindrical rod to push on the sand and apply compression. The applied pressure caused the grains to deform until some grains actually fractured. The AE events that resulted were sub-micron to mm in size, giving rise to signals with frequencies in the range of 10 kHz to several MHz.
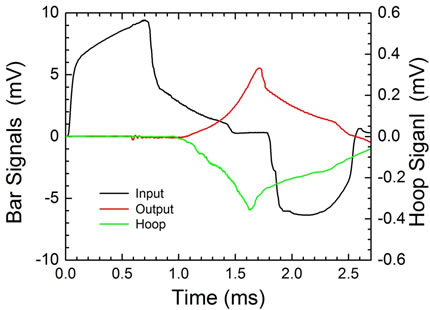
We also compressed the outside of the cylinder and used a strain gauge attached to the data recorder to measure lateral deformation for additional AE data. We connected the strain gauge to the Genesis using a Wheatstone bridge that was powered by 10 volts DC. The signal was magnified by a signal amplifier. The voltage from the signal amplifier was converted through the Genesis via another circuit. Even at a fast data sampling rate of 10 MS/s, the data recorder readings were accurate and of a high resolution. The recorder’s built-in 10x amplifier/conditioner signal conditioners also helped ensure high quality data.
Next, we correlated the AE spikes in frequency shown on the Genesis with the deformation of sand grains and the number of sand grains that fractured. The events proved to have two entirely different signatures. Sand grains sliding against each other caused a low frequency wave and low amplitude of sound, while grain fracture caused a high frequency wave and high amplitude acoustic wave.

