Cleaning Useful Information from Noise Cleaning Useful Information from Noise | HBM

More efficient noise analysis with state-of-the-art measurement technology

Cleaning useful information from noise

Understanding the sources and causes of acoustic noise of machines or system components under investigation is becoming more and more important in development, experimentation, production sampling, service, and maintenance. After all, the “extra quantity” of acoustics is often crucial for comfort, occupational health and safety, and brand image in the complete product life cycle.

In the past, engineers needed to employ additional tools when measuring acoustics - forcing them to battle with different devices, user interfaces, philosophies, and data formats. Today, however, measurement tools such as HBM’s QuantumX and catman®AP data acquisition solution provide detailed acoustic measurement analysis capabilities along with a full suite of features for acquiring mechanical, thermal, electrical, and digital bus signals such as CAN, as well as GPS and video signals. For acoustic measurement, in particular, engineers can take advantage of features such as sound-level analysis in dB(A) with psychoacoustic evaluation according to loudness and frequency analysis in the 2-D spectrogram.

With these multipurpose measurement tools, engineers can quickly and easily complete acquisition and analyses jobs with just a few clicks and save all the data in a single file. This approach not only allows more effective measurement of events but also simplifies and speeds comparison with earlier measurement results in trend analysis studies. Finally, these tools offer a compact, portable solution required for service and maintenance tasks.

Noise engineering

In the automotive market, the terms noise, vibration and harshness, or NVH for short, are typically used to describe audible noise or perceptible vibrations in vehicles or machines. Harshness is the subjective transition region between 20 and 100 Hz that is both audible and perceptible. Vibration arises from the force introduced by a vibrating source into vibration-transmitting structures such as self-induced stick-slip effects. Typical examples of NVH are stick-slipping windshield wipers, transmission whine, a gripping clutch, or noisy air conditioning systems.

NVH arises from either the side effects of desirable friction or the unwanted result of friction between solids, which leads to the emission of structure-borne noise and ultimately audible air-borne noise. In a solid that is unrestricted on all sides, two different kinds of structure-borne sound waves propagate: so-called longitudinal waves and transverse waves. These waves propagate independently of one another. In both cases, the sound velocity, as with air-borne noise, is not dependent on the frequency. The sound velocity is affected by density, the modulus of rigidity (transverse waves), and the modulus of elasticity (longitudinal waves).

The recording and analysis of structure-borne noise plays a major role in engineering. During development of mechanical systems, noise analysis can aid testing of overall function, run-up, performance, durability, and even lifetime. In production, noise analysis can augment quality inspection processes by ensuring acoustic constraints are met during integration of parts into car interiors, steering assemblies, and others. Throughout the product life cycle, noise measurement provides critical information needed for continuous analysis of long-term structure health and diagnostic data during routine inspection, fault investigation, troubleshooting, and calibration or adjustment. Engineers can analyze the noise properties of systems or the technical status of a machine for problems such as bearing wear or record data related to the development of cracks and material failure.

The nature of noise

With NVH, it is a matter of avoiding vibrations that could reduce comfort. In acoustic science, the nature of acoustic discomfort relates to a variety of characteristics of the source including the sound pressure level. For example, the sound of an operating jet engine, concert, or heavy truck can be uncomfortable simply due to the high volume of sound.

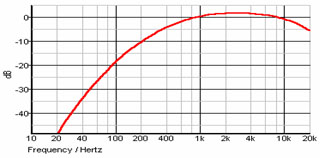
Beyond high-volume sources, however, the relationship between the characteristics of a noise source and the perception of that noise can be complex. Human hearing perceives the sound of varying frequencies as being more or less loud. The sound pressure level or noise level is a psychoacoustic quantity.  During measurement, noise signals are filtered so that they imitate the properties of human hearing, which falls off from a peak sensitivity range of about 2 kHz to 4 kHz. The weighting curves of these filters are standardized.

We speak of a so-called A-weighting of the sound pressure level, short dB(A). Zero dB(A) corresponds to the threshold of hearing (auditory threshold). The A-weighting filter curve is defined from 20 Hz to 20 kHz. This is intended as a rough replica of the 40 dB loudness of the curve of “equal-loudness contours” for low frequencies. The threshold of noise pain is just about 130 dB(A). It is very easy to convert sound pressure into the sound pressure level (SPL) by using the “computation channels” of advanced acoustic measurement gear.

Noise measurement

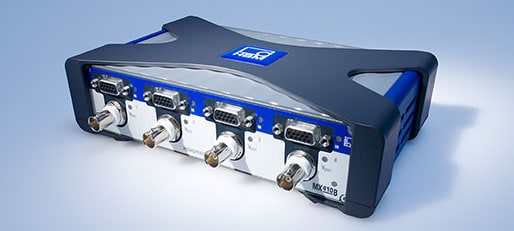
General acoustic measurement typically begins with the use of a high-quality microphone. Using the Microtech Gefell measuring microphone M370 as an example, the built-in converter type of microphone includes an electret pressure receiver with a circular characteristic. Constant current from the QuantumX MX410B amplifier feeds the mic, and the measured sound pressure is modulated to a voltage signal (IEPE). The measurable frequency range is between 20 and 20,000 Hz (class 1, open-air use). The maximum sound pressure level is 130 dB(A).

For the actual signal acquisition and processing, tools such as HBM’s QuantumX and catman®AP software provide a complete acoustic-signal-processing platform. QuantumX is a modular data acquisition solution capable of collecting data at 0.1 to 100 kS/sec simultaneously from multiple sensors and transducers measuring force, strain, torque, pressure, temperature, displacement, speed, position, acceleration, flow, voltage, current, noise, and many other characteristics. Along with its data acquisition functionality, catman®AP software provides an integrated math library for online and post-processing calculations. The mathematical functions extend from simple algebraic calculations, filters, statistics, and classifications such as rain flow or time-at-level, to spectral analysis, calculation of electrical power, and efficiency through simple parameterization.

Noise-analysis requirements

To uncover the underlying causes of noise, engineers depend on several essential analytical functions to give them a clear picture of the system under testing including noise. Among these functions, some of the most common include:

  • Presentation over time, frequency, angle, or other quantities such as displacement, or rotational speed (tachometer)
  • Presentation in a color spectrogram as power-spectral-density (PSD)
  • Overall sound-level characteristic in dB(A)
  • Band-limited level characteristic in dB(A)

Analyzing a signal in frequency-domain does not show how the frequency content of a signal evolves over time. For this task, features such as the spectrogram in catman® provide the needed result. The spectrogram directly shows a Joint-Time-Frequency-Analysis (JTFA) by computing the frequencies contained in a signal with the associated color-coded amplitudes over time. The catman® software uses the so-called Short Time Fourier Transform (STFT) to calculate the JTFA and applies a Fast Fourier Transform (FFT) repeatedly to short segments of a signal over time. In essence, the JTFA of a spectrogram shows more details than a standard FFT: frequency content (y-axis) over time evolution (x-axis), shown in a so-called 2-D 1/2 visualization where amplitude or energy is mapped to a color code.

The JTFA relies on parameters such as the number of measured values used to calculate the spectrum. The rule of thumb for these measurements is the more measured values you include in the FFT, the more accurate the resolution in the frequency range. Another parameter is the window function, which determines the weighting to be applied for sampling values derived from sampling a signal within a segment (window) when they are used in the calculation. If multiple channels are assigned to the graph, the spectra of the channels can also be displayed as the vector sum.

With the QuantumX / catman®AP measurement-and-analysis toolset, engineers can analyze all physical quantities of systems or products under investigation - including sound - whether for engineering, testing, production, or maintenance purposes.