catman FAQs | Visualization and Recording catman FAQs: Data Visualization and Recording | HBM

catman FAQs: Data Visualization and Data Recording

Here you will find answers to the most frequently asked questions about visualization and recording in HBM's catman data acquisition software, such as:

Data Acquisition

In many cases, your DAQ project contains channels that should record highly dynamic signals (e.g. accelerations) together with channels recording signals which change slowly over time (e.g. temperatures). The bandwidth of the dynamic signals thus determines the sample rate (Nyquist theorem). Acquiring the slow signals with the same sample rate would lead to an unnecessarily large amount of data to be transferred for these channels. For that reason, catman provides a second, slow sample rate.

To specify the channels which should be acquired with slow rates use the context menu of column 'Sample rate/Filter' in the channel list on the  'DAQ channels' tab. You may set up multiple, selected channels simultaneously.

catman Enterprise uses the hardware triggers inside the devices. catman Easy/AP however monitors the trigger by software: data is first transferred to the PC and then monitored for trigger conditions. If a trigger is detected, data storage starts (start trigger) or stops (stop trigger). This method has several advantages:

  • you may observe your data on the screen even before the trigger event occurs
  • you can use computation channels for triggering
  • additional trigger functions not supported by hardware (stop trigger with Spider8, post-stop-trigger samples)

On the other hand, trigger monitoring in catman Easy/AP is somewhat slower than in catman Professional. In catman Easy/AP trigger monitoring typically occurs 10 to 20 times per second. This is however enough for data storage to start/stop.

If burst mode is active, the job will not terminate when the stop condition occurs. Instead, the job starts waiting for the next start trigger event again.

Re-triggers are possible in DAQ jobs with both a start and a stop trigger. In the post-trigger phase after detection of the stop condition, the start condition is monitored again. If the start condition is met before the post-trigger time is over the post-trigger phase is reset and starts again.

During a running DAQ job devices like MGCplus, PMX or Spider8 continuously fill sample data into an internal RAM buffer. For other device types (like QuantumX/SomatXR) not featuring an internal buffer, the catman device driver layer will buffer the incoming data. From this buffer, they are fetched by catman Easy/AP at a regular time interval (typically every 100 ms). This usually happens at the same rate as data coming in - i.e. the buffers do not fill up significantly.

If, however, for some reason catman Easy/AP cannot transfer the data fast enough, the buffers start filling up. In that case, the data you observe on the screen are no longer 'real-time': you see past data while the most recent data is still in the buffer. This time difference is denoted as 'Real-time lag' (RT-Lag) and will be displayed in the status bar of catman Easy/AP.

An RT-Lag of several seconds should be taken seriously! The RAM buffers are filled up significantly in that case and might overflow shortly. If that happens the DAQ job is aborted! The following device types feature internal RAM buffers:

  • 20,000 samples for Spider8
  • 6,000,000 samples for MGCplus CP42 with Standard-RAM (RAM-extensions optionally available)
  • 2,000,000 samples for MGCplus CP32 with Standard-RAM (RAM-extensions optionally available)
  • 1,000,000 samples for MGCplus CP22 (RAM-extensions not available)
  • 5 MB for PMX

The specified number of samples is the sum of all samples from all active channels! For instance, the RAM buffer of an 8-channel Spider8 may hold up to 2,500 samples/channel.

QuantumX/SomatXR don't feature an internal RAM buffer - buffering is done by the catman device driver layer: 5 s buffer, however, at least 30,000 samples.

RT-Lag typically is an issue with sample rates > 1200 Hz. You may take several measures to reduce the risk:

  • Do not use too many graphics (two or three is ok).
  • Do not update real-time graphs too frequently (graph configuration dialog/Special/Update).
  • Especially the post-process graphs should be updated only very rarely.
  • Do not use auto-scaling in graphs (time consuming since axis scaling must be computed anew with every new block of data).
  • Only display those channels you are really interested in. For instance, a table indicator (spreadsheet) by default displays all active channels. In many cases however not all these channels must be observed during the DAQ job!
  • Avoid using too many digital indicators on a single visual panel - use the DAQ table instead.

You may even take interactive measures against a RT-Lag. This can be done even if a DAQ job is already running! If a DAQ job is running double click the "RT-Lag" field of the status bar. If no DAQ job is running select the ribbon "Visualization", group "Measurement", button "Performance". In the following dialog you may for instance reduce the refresh rate of indicators, restrict graph refreshes to the visible panel or totally block the refresh of graphs.

If these measures are insufficient to prevent a RT-Lag you can utilize a temporary measurement storage of fixed size (File/Options/Data storage). Compared to standard measurement storage with dynamically increasing size this optimizes data storage performance. In that case you must specify storage large enough to contain all measurement values of your DAQ job.

Configure a post-process graph with the desired channels. Contrary to a real-time graph a post-process graph always shows all samples of a channel acquired so far. It is updated automatically only after stop of DAQ or addition of a new channel to the graph. You are prompted to set the update interval at the creation of the post-process graph.

In addition, you can set up a post-process graph for automatic update at certain intervals (graph/configuration/dialog/Special/Update). Note that the update takes progressively longer with the increase of the dataset length, so you are running the risk of an RT-Lag if you are updating the graph too often at higher sample rates. 

The file formats available include catman 5.0, ASCII with and without channel headers, MS Excel, NI Diadem, nCode S3T, nSoft DAC, Matlab, MTS RPC III, Vector MDF 3 and ASAM MDF 4.1 Format, Universal File Format Type 58, and TDMS.

Note: Only files in catman formats can be reloaded in catman Easy/AP Analysis mode!

In the DAQ job settings select 'Data storage/File format/ASAM MDF format' as export format. Click the 'Options...' button to open the settings dialog of the MDF 4 format. Here you can enable the MDF 4 file features 'Data compression' and 'Data reduction'.

Please verify that the storage option in your Excel application is not set to 'Microsoft Excel 2003' or older. If so, please change this to the standard format Office 2007/2010 (XLSX).

After DAQ start, a small toolbar pops up which allows control of manual storage. There are buttons for storing and deleting a single sample and one for switching on/off continuous storage. The number of stored samples is shown on a display. The toolbar is only visible during measurement.

In this mode only a Min/Max pair is stored after the specified time interval elapses. This storage mode is especially useful for long-duration tests in material testing where load cycles are monitored for days or even weeks. Instead of storing all data only the 'trend' of the peak values is stored.

All sample data of a DAQ job is still stored in the catman Easy/AP temporary database ('Keep all data' is selected by default as storage mode) and can still be saved to a file with the menu function 'File/Save as/Save last DAQ job'. Observe, however, that no new DAQ job must be started (this overwrites the data in the temporary database), and that catman Easy/AP must not be terminated.

In the DAQ job settings select 'Data saving/ Periodically during measurement' as the storage option. In this case, catman Easy/AP will store the data permanently to disk at a certain interval while the DAQ job is running.

Note: Due to performance reasons (the storage process consumes time during which the data transfer is halted) this storage mode is not available for high sample rates:

  • up to 100 Hz with Spider8
  • up to 1200 Hz with MGCplus and QuantumX (these devices have larger internal data buffers)

catman Easy/AP will check upon startup if the data stored temporarily during the last session still exists (with regular program termination this store is deleted). In that case, the user will be prompted to recover and permanently store this data.

After a power failure or program crash, please restart catman Easy/AP immediately. Do by no means delete any files or directories before restarting catman Easy/AP.

No, the static temporary measurement data store is created based upon a maximum number of channels and a maximum number of samples per channel. Deactivation of some channels will not increase the available amount of storage space to the remaining active channels.

No, the number of hardware and computation channels cannot exceed the maximum number of channels in temporary data store regardless of activation state. Otherwise a measurement is not possible.

In a slow wireless network, the timeout catman uses to query the MGCplus devices for data might to be too low (by default this timeout is 500 ms). You may however adjust this value using a registry entry in HKEY_LOCAL_MACHINE/SOFTWARE/HBM/CATMAN with the value 'MGCGetFifoTimeout' (of type TEXT). Observe that the value will usually not yet exist - you must create it.

Events that occurred during a running DAQ job are automatically logged and stored in a file with the file extension '. events'. With this file you can analyze the events later.

Also, events of various sources can be automatically stored in the system log. Go to Options/Safety/Safety prompts and logging and activate the checkbox for the desired log type. Select menu DAQ channels/Special/ Show system log to view the logged events directly in a text editor.

Online Visualization

You need this list to assign channels to indicators or graphs. Just drag a channel from this list to an indicator or graph. If the channel selection list is not visible, select the menu 'Channel list' in the 'Window' menu.

The channel selection window features two controls to remove all channels from all indicators and graphs and to automatically assign (in ascending order) channels to all objects on the panel. If you closed the channel list window by clicking the X-button you can show it again by using the menu Window/Channel list.

Moreover, the channels can also be assigned to the active object by double-clicking in the channel list. If the channel is already displayed in the object, it will be removed instead.

In this case catman Easy/AP will offer a popup menu allowing you to select a visualization object which should be used to display the channel. You may however change this behavior via the options settings for the panel (main menu Options/group Panels/Drop of channel onto panel creates): instead of displaying a popup menu catman can also create a specific object automatically.

Simply select multiple channels and drag them to an empty area of the panel.

You may create up to 64 panels or pages (Analysis mode). You can set the maximum number of objects per class by yourself (main menu Options/group Panels/Max. number of objects per type in the project). The default settings are:   

  • Sum of Real-time and post-process graphs: 128
  • Cursor graphs: 128
  • Polar graphs: 128
  • 3D graphs: 64
  • Tables, digital indicators, LEDs, meters and bar indicators: 256 of each type
  • Sum of Texts and background pictures: 512
  • Sum of script objects (buttons, checkboxes, combo boxes, etc.): 256 of each type

To move: Press the left mouse button while the mouse is over the object and move the mouse while still holding the mouse button pressed. Upon releasing the mouse button, the object moves to the new position.

To resize: Grab and drag the objects with the resizing grabbers at the sides and corners of the active object.

Under 'Options', register tab 'Panels' you will find options by which you may control whether objects are aligned to the grid (upon repositioning or resizing) as well as the grid size and appearance. The possible range of the grid size is 50 to 1,000. The default is 200. Alternatively, you may access these options using the panel configuration dialog.

The configuration dialog of the selected object appears usually on the right side of the main window and shows the properties of the currently selected object. However, the Visualization tab on the ribbon must be selected at this moment - the dialog is not available in the Cockpit tab. 

If the configuration dialog is not visible, you can show it again by using the menu Window/Object properties, or the context menu 'Properties' of the selected object.

Click on objects while simultaneously pressing the <CTRL> key. Objects selected are indicated by a small square with a check mark in the upper right corner. Click on an empty area of the panel removes multiple selections.

With multiple objects selected you may perform the following actions:

  • Move: Drag one of the objects selected - all other objects will be moved accordingly.
  • Copy, Paste, Delete (via context menu).
  • Font style (font name, bold, italic), font size and color: Digit indicator, LED, text object, button, textbox, checkbox, list box, knob, slider, slider switch, and on/off switch are supported.
  • Text color: Meter, bar and digit indicators, LED, text object, button, textbox, checkbox, list box, knob, slider, slider switch, and on/off switch are supported.
  • Text alignment: Digit indicator, text object, and textbox are supported.
  • Background color: Meter, bar and digit indicators LED, text object, button, textbox, checkbox, list box, knob, slider, slider switch, and on/off switch are supported.
  • Template: Meter, bar and digit indicators are supported.
  • Display mode (minimum, maximum, current value etc.): Meter, bar, and digit indicators are supported
  • Decay time: Meter, bar, and digit indicators are supported.
  • Gradient style and color: Meter, bar and digit indicators, LED, and text object are supported.
  • Transparency: Meter, bar and digit indicators, LED, and text object are supported.
  • Border style: Meter, bar and digit indicators, LED, and text object are supported.
  • Show or hide the physical unit: Meter, bar, and digit indicators are supported.
  • Number format: Meter, bar, and digit indicators are supported.
  • Image orientation: Button object is supported.
  • Picture position: Text object is supported
  • OK color: Digit indicator is supported.
  • Visual style: Button, textbox, checkbox, and list box is supported.

In the configuration dialog of an object click the template button. All new objects of this type will be created with the template configuration. Clicking the undo button in the configuration dialog will reset the object template to the default values.

First, define one or more limit value conditions (via the button 'Configure...' in the group 'Limit values and events' from the 'DAQ channels' register tab) and assign them to DAQ channels using the context menu of the DAQ channel table.

If the menu 'Limit values and events' is not visible, the option 'Limit value/event monitoring' is deactivated. Activate the option via menu 'File/Options', register tab 'Program functions'.

Now create an LED object and open the corresponding configuration dialog. Select 'Limit value monitoring channel (LV1)' as 'LED function' in the 'General' group. Finally select the channel to monitor. If you want to visualize the second or third limit value condition, select LV2 or LV3.

In the graph's configuration dialog under 'Special', you will find a list labeled 'Display limit values' (only visible if at least one limit value has been defined). From the list, select the limit value you want to be displayed in the graph. A limit value will be represented by two horizontal lines representing the alarm and warning levels. The color of these lines depends upon the colors you assigned when creating the limit value.

Note: Limit value display can be configured for every y-axis system individually.

First, enable 'Limit value/event monitoring' in the 'Options' dialog under 'Program functions'. Then, within a new DAQ project, start the 'Configure limit value and event monitoring' dialog (button 'Configure...' in group 'Limit values and events' from the 'DAQ channels' register tab). Add one or more limit value conditions and assign corresponding colors.

Now select a channel (within the 'Channel settings' window) and assign one to three limit values to the channel using the context menu of table column 'Limit value monitoring'.

Finally, go to the digital indicator's configuration dialog to choose the limit values to be displayed.

The possible range for the grid size is 50 to 1,000. The default is 200.

If you don’t want to save each panel separately, you can alternatively save the entire DAQ project under 'File/Save/Project'. Later, you may import the entire visualization (which means all panels) from this project under 'File/Import/Import visualization'.

The entire panel with all its objects can be upsized or downsized in steps via the buttons'Decrease' and 'Increase' in the group 'Panel/page' of the ribbon bar to fit the panel to your screen.

Video Camera

Go to 'Main menu/Options' and activate the additional module 'EasyVideocam' on the register tab 'Program functions'. After that, a new tab labeled 'video cameras' appears in the Ribbon.

To activate EasyVideocam you need either a license of the optional module EasyVideocam or a full license of catman AP. Otherwise, you will be prompted for the EasyVideocam license every time you try to activate EasyVideocam. If you enter 'EVAL' as license number, you may operate EasyVideocam in evaluation mode up to 25 times.

The EasyVideocam module is available only in DAQ project mode. However, you can replay the recorded video of a DAQ test in analysis mode.

You may use up to 8 cameras in a DAQ project. catman Easy/AP supports common USB webcams and network cameras which are connected directly via Ethernet or FireWire.

Camera configurations are automatically stored together with your DAQ project - Therefore you do not need to save the camera configurations separately.

Video recording can be started/stopped in several different ways:

  • Automatically on DAQ job start/stop.
  • Automatically on start/stop trigger.
  • By event monitoring or script.
  • Select the start/stop mode of video recording via the 'Video' of the 'DAQ jobs' tab.

Yes. Create a new visualization object of the type 'Video camera display' on a panel. In the configuration dialog, select the desired camera and make sure that the 'Live' option is enabled.

Perform a rescan (function 'Rescan' in the tab 'Video cameras' in the Ribbon) to scan all the available cameras.

Use the buttons 'Record' and 'Stop' in the function group 'Test recording' to control the recording of a video sample. Press the 'Play' button to watch the video sample you have last recorded before you decide whether to continue a video recording with the current camera settings.

Go to 'Video' of the 'DAQ jobs' tab. Enter a name for the video file directly into the text field 'File name', or in the file selection dialog 'Video recording file', select the folder and enter the desired file name in the 'File name' field. Also, you can use placeholders in the file name (e.g. date or time).

  • Reduce the resolution as far as acceptable (640 x 480 is usually sufficient)
  • Reduce the frame rate as far as acceptable (10 - 15 fps is usually enough for the applications catman is targeted for)
  • Record only the relevant video information for the measurement by starting/stopping the camera through Start-/Stoptrigger or event monitoring or script

To prevent the hard disk from filling up, you can set an appropriate limit on the size of video files (group 'Video' in the Ribbon tab 'DAQ jobs'). If the size limit is exceeded, video recording will stop automatically.

Yes, audio recording is supported in catman.

Scope Panels

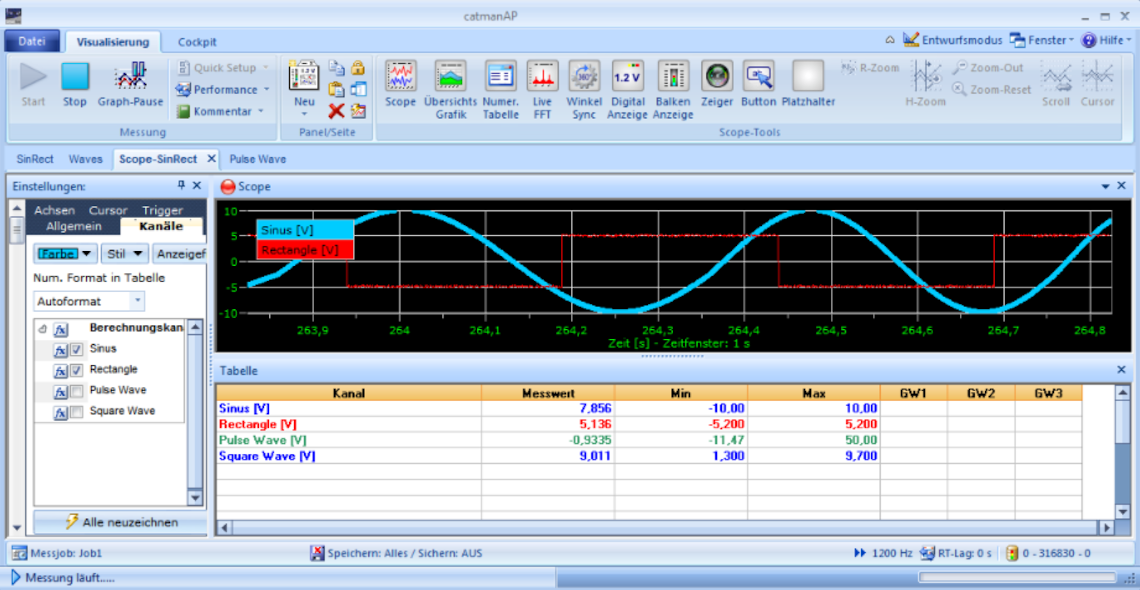
A scope panel is a highly integrated visualization module which does not require to build up the visualization by dragging graphs and channels. Instead, one graph window is already there, and channels can be added by just clicking (checking) a channel in the channel list integrated into the scope panel.

It is not possible to add other objects from the visualization toolbox to the scope panel. You may, however, create sub-windows inside the scope panel (also denoted as layers or panes). The following types of sub-windows are supported:

  • Real-time y(t) graph
  • Review y(t) graph
  • Numerical table (spreadsheet)
  • Live FFT graph
  • Angle synchronous display
  • Digital indicator
  • Bar indicator
  • Pointer (Analog meter)
  • Button

Up to 8 scope panels can be created. The maximum number of sub-windows that can be created on each scope panel is limited to 64. These sub-windows can be moved to any docking position and can even be 'undocked'.

Graph refresh can be paused at any time to zoom into the graph or use cursor functionalities. After resuming of update all curves are repainted from the temporary data store.  

The scope display can operate in an oscilloscope like trigger mode. Scope provides a minimum time window of 0.01 ms in contrast to the 0.5 seconds in ordinary real-time graphs. This makes the scope useful in DAQ jobs with very high sample rates > 10 kHz.

A sub-window is activated by clicking it and can be recognized by the red ball on the left side of its caption bar.

Curves are assigned or removed by checking or unchecking a channel located in the channel list on the left side of the scope window. The operation is performed on the currently active sub-window. A sub-window is activated by clicking it and can be recognized by the red ball on the left side of its caption bar.

  1. Make sure the scope is not in 'Pause' mode.
  2. Just like any other visualization object the scope requires a running DAQ job. It is not possible to start a DAQ job from within the scope window.
  3. Data possibly lies outside of the current scale range. Activate 'Auto scale' for all axes and reset zoom mode.
  4. The trigger condition is not met (if operating the scope in trigger mode).

The user interfaces of zoom, x-axis shifting, and cursors are coupled to pausing of the graph update: relevant elements are enabled only when the update is stopped.

You can set up curve colors individually by clicking on the channel in the channel list and then selecting the color with the color picker control located on top of the channel list. In the same manner, you may select the curve style.

A scope can have a maximum of 64 layers and each layer can hold a maximum of 16 curves.

By default, the scope operates in 'chart mode', i.e. new data will appear at the right side of the time window while older data vanishes on the left side. Using the trigger modes, the time window will be filled exactly once. Filling begins when the trigger condition is met. This procedure (a 'shot') can be repeated automatically (continous mode) or exactly once. In the latter case, use the button 'Start' right to option 'Single shot' to trigger a new shot.

Note: Press <RETURN> to confirm the settings for level and pre-trigger.

AutoRange is a special autoscaling mode which forces the y-scale to a band around the newest data point in the graph. This is useful if the signal shows abrupt amplitude changes - in such a case 'older' data (i.e. data before the change) still visible in the time window will make ordinary autoscaling useless.

Enter the bandwidth in the text box 'Range' under the AutoRange checkbox and press <RETURN> to confirm the input.

Floating Panels

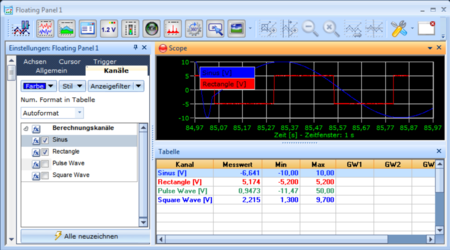
Use the floating panel (only available in the DAQ mode) to obtain a separate window that can be moved to a second monitor. You may create sub-windows inside the floating panel (also denoted as layers or panes). The following types of sub-windows are supported:

  • Real-time y(t) graph
  • Review y(t) graph
  • Numerical table (spreadsheet)
  • Digital indicator
  • Bar indicator
  • Pointer (Analog meter)
  • Live FFT graph
  • Angle synchronous display
  • Button
  • Video camera display
  • Picture
  • Website

Up to 32 floating panels can be created. The maximum number of sub-windows that can be created on each floating panel is limited to 64.

The floating panel window can be moved freely on or to the screens (outside of the catman Easy/AP window). In comparison to the scope panel, you have more display objects available. Moreover, the floating panel has its own ribbon for configuration. 

Yes. Click on the Tool-symbol on the ribbon of the floating panel and select the menu 'Save panel' to export all the panel configurations to a file.

Yes, there are two possibilities to duplicate a floating panel:

  • Click on the Tool-symbol on the ribbon and select the menu 'Duplicate panel'. An exact duplicatie of the current panel will be created.
  • Create a new floating panel. Then click on the Tool-symbol on the ribbon and select the menu 'Load panel' to load the complete panel configuration from a template file.

Click on the symbol on the ribbon to close the current floating panel. You will be prompted to confirm this action.

Clicking on the (X)-button in the title bar will only minimize the panel. All panel configurations made will be lost if you close the floating panel. Save the panel to a file before closing if you want to keep it.


catman FAQs: Setup of DAQ Project

Find answers to the most frequently asked questions about setting up a DAQ projet in HBM's catman data acquisition software.

catman FAQs: Data Handling and Data Analysis

Find answers to the most frequently asked questions about data handling and data analysis in HBM's catman data acquisition software.


Do You Need Support for Your Measurement Project?

  • Our professional service and support team will assist you in all issues regarding catman data acquisition by email, telephone and/or remote. We are looking forward to hearing from you.
  • Get your catman knowledge up to date with our Global Academy and benefit from a 15% discount following purchase of catman. We offer you online and remote trainings and webinars for catman.