Monitoring Electric Power for Extended Periods of Time Monitoring Electric Power for Extended Periods of Time | HBM

Monitoring Electric Power for Extended Periods of Time

Extended monitoring of electrical power needs to be done for power grids and inverter-driven electric machines to characterize their long-term behavior. Power systems will often experience a variety of events that can cause durability issues or failures in sub systems. Often, the reason for a sub system failure will be unknown, and measurements will need to be made over an extended period to identify the root cause so that engineering decisions can be made.

Determining the root cause of motor failures

Monitoring power for an extended period on an inverter-driven system can be difficult due to the required sampling rate needed to accurately measure electrical parameters. Even inverters with switching frequencies as low as 8kHz will require sample rates above 100kHz to accurately measure their electrical values. This high frequency information can also contain an overwhelming amount of data if continuously monitored and recorded. For this reason, many extended monitoring tests can sample at a lower sampling rate and use calculated values to monitor and trigger temporary high speed acquisition. Potential calculated values to monitor include RMS, Power, Total Harmonic Distortion (THD), individual harmonic monitoring, and other values like Id or Iq.

These time averaged values can give a significant amount of information about what is happening in the system while avoiding creating a significant amount of data. These measured values will be proportional to the fundamental frequency and will often be in the 100’s of Hz range which will significantly reduce data while providing excellent information on system behavior. Examples of information taken from monitored signals include the following:


  1. RMS values can show long term, or sudden changes inthe amount of voltage or current consumed.
  2. Power consumed can show if the operation of a system is drastically changing over time.
  3. Efficiency can show if the system is experiencing additional losses over time.
  4. THD is a leading indicator for failures.
  5. Individual harmonics can give more information on the nature of a failure.
  6. Control variables can show if current is shifting from useful torque to other parts of the system.

Correlating failures to heat

These values can all be corelated to temperature or aligned with failures to increase the amount of information that is obtained. Correlating to heat helps engineers identify what is the cause of failure when it occurs. There is also a significant amount of literature available for what are leading indicators of failures in machines and power systems.

Some of the failures that could happen:

1.Turn-to-turn shorts
2.Phase-to-phase shorts
3.Delamination
4.Demagnetization

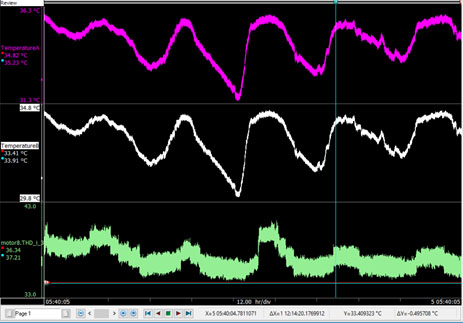
An example of a monitoring test is the following five-day study done on an electric motor. In this test, motors were failing for an unknown reason. The test included recordings of the THD and RMS values of the phase currents and voltages, in addition to temperatures. This test was an initial investigation into the root causes of failure.

An HBK eDrive power analyzer was used for the measurements. This includes a HBK eDrive power analyzer and HBK’s Perception software. The eDrive was ideal for this measurement, with its ability to simultaneously acquire up to 51 channels of electrical power, combined with additional mechanical and bus data in a single data file. The eDrive has sample rates up to 2MS/s and can store data at 400MB/s. Data can be stored for as long as there is hard drive space, but the eDrive also provides real time formulas to store just calculated values for extended testing. The eDrive can measure up to 1.5kV directly with an accuracy of 0.015%.

Figure 1 shows the THD in the motor increasing and decreasing with the two ambient temperatures measured over the five-day period. This indicates a strong relationship between motor failures and the thermal environment. THD could be the root cause of that failure. This points to the need to reduce THD to reduce the frequency of this failure. The THD was calculated for all the voltage and current channels every 10 electrical cycles from a 2MS/s sampling rate. The temperatures were recorded with the same device for time alignment and ease of analysis. The eDrive system can store this data for an extended period, showing 5 days’ worth of data in one file. 

Historical data indicated that the three motors with the highest THD in this study had the highest failure rates in service. From this test, the engineers identified that they needed to minimize their THD to reduce the number of motor failures. This initial investigation led to more detailed analysis of failures but was a crucial starting point in determining the root cause of the motor failures.