Integrated press-monitoring Integrated press-monitoring | HBM

Tips for use : CODESYS Application – Press Monitoring

These instructions describe how to create a CODESYS application for PMX. Basic experience with CODESYS is assumed. Experienced users are free to adopt a different approach. Further help is available from the examples that are installed as standard on the desktop when the PMX package is installed and from the online help for the package.

The necessary files can be found on the "PMX CODESYS" CD that is included in the scope of supply of every PMX containing CODESYS or can be downloaded from the support page at hbm.com.

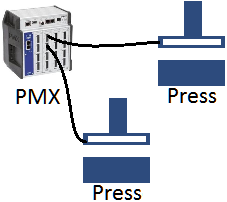
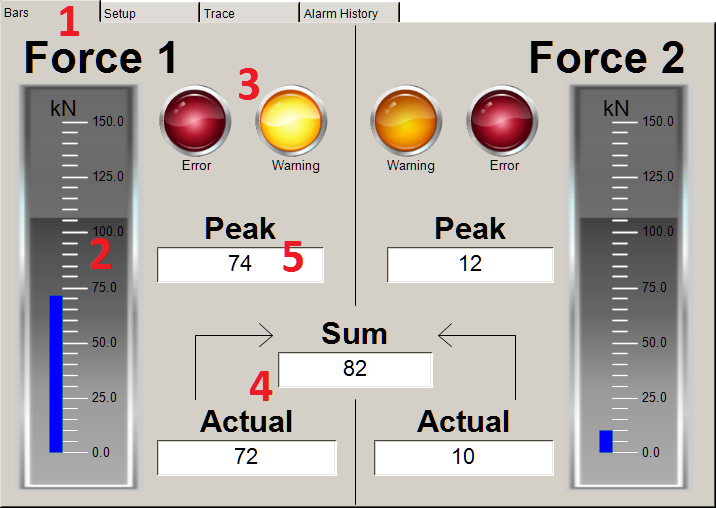
The example shows how to use the PMX to monitor presses. Its visualization provides several views for observing different aspects of the process. The currently measured forces are visualized in bar diagrams on the main page.

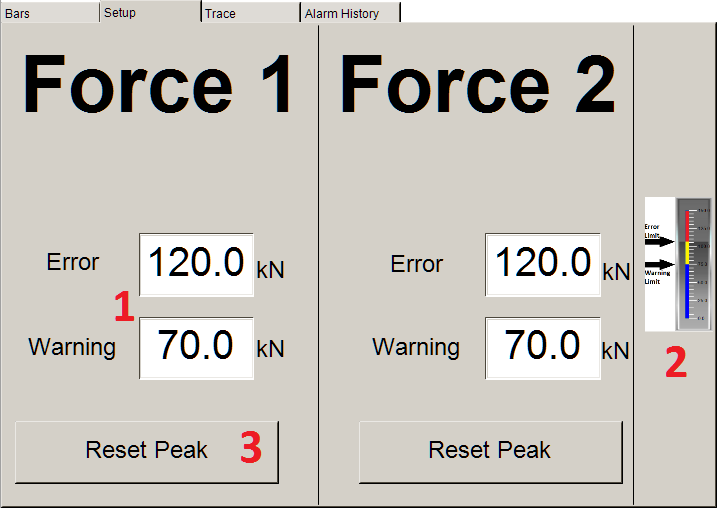
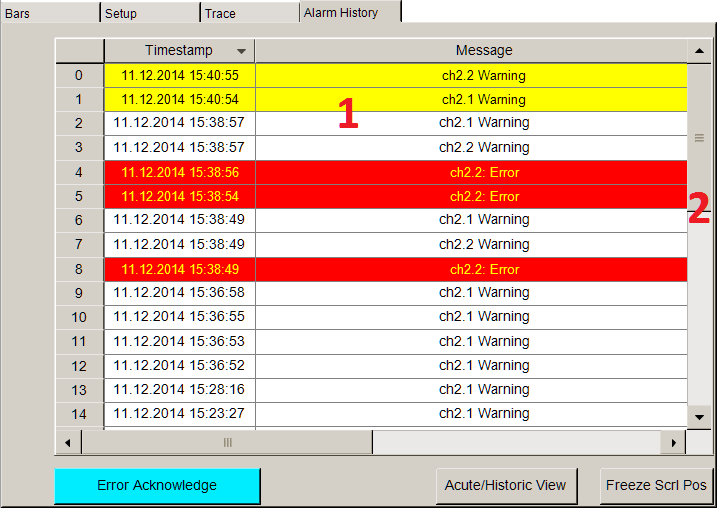
The limit switches triggering either a warning or an error message can be configured on the second page.

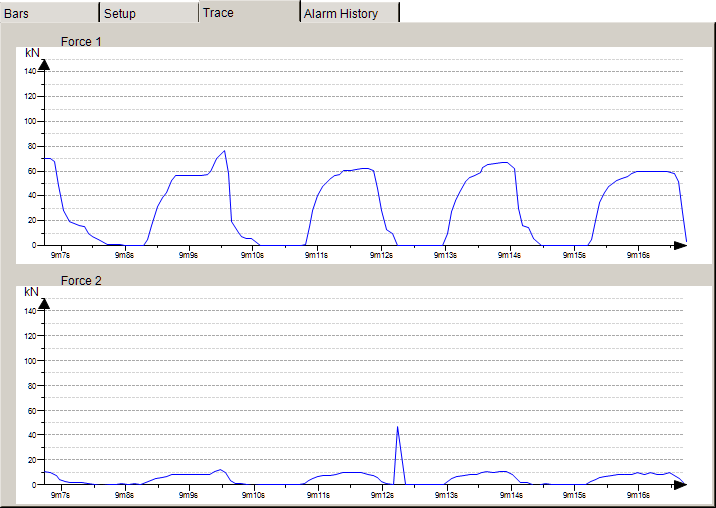
In addition, the traces are plotted on a third page. The limit violations including their time stamps are recorded on an alarm page.

Extract CODESYS package

Open the development environment
Run CODESYS software as admin.

Extract package

Connect PMX

Add gateway

Double-click “Device (CODESYS Control HBM PMX V3)“ and then press “Add gateway…“ on the right-hand margin. Keep the default settings and confirm by pressing “OK”.

Integrate PMX

The “Scan network” function should automatically detect the PMX. Activate the device by double-clicking it.

Press monitoring

This application is structured in four views that can be selected by clicking on the corresponding tab at the top of the visualization (see Bar diagrams (1)). The bar diagram is the main page of the application and is sufficient for standard monitoring purposes. The “Setup” page provides the preferences that can be changed. “Trace” shows the signal traces of the last ten seconds and “Alarm History” records the Warnings and Errors.

If an error occurs all visualizations freeze, including the traces. The frozen traces in particular enable the user to identify the cause of error. When the error has been fixed and the message acknowledged, monitoring can continue.

Bar diagram

The ”Bars“page shows the bar diagrams for both forces

  1. Tabs for switching the views
  2. Bar diagram: The blue bar enables the current force to be read
  3. Lamps which indicate errors or warnings. For illustration purposes a warning lamp is on.
  4. Indication of the current force value and the sum of forces
  5. Indication of the highest peak at run-time

Preferences

The limit switches for warnings and errors can be customized for each channel individually on the “Setup” page (1). A sketch explains the setting options (2). Press the “Reset Peak” button (3) to reset the measured peak values.

Traces

This view enables the signals of the last ten seconds to be monitored. They freeze when an error occurs and continue as soon as the error message has been acknowledged.

Alarm table

The alarm table shows at which time warnings or errors occurred. In this view the user can toggle between the acute view and the historical view (3). Warnings are highlighted yellow in the acute view, however, they disappear as soon as the situation is over. In contrast to this, errors messages are held in the table and recording stops (however, the recording of warnings and errors continues).

To continue monitoring, click the error messages (1) and then the “Error Acknowledge” button (2). The “Freeze Scrl Pos” button (4) freezes the historical view for focusing on the recent time period.

The historical view documents the last 100 warnings and error messages. Warnings also shown in the acute view are highlighted yellow, warnings that are no longer up to date have a white background (1). Error messages are highlighted red if they have not been acknowledged and an error message was sent by the same signal in the meantime (2). Acknowledged error messages also have a white background.

TIP

Further information and help with creating Codesys programs is available from the Codesys online Help, on the Internet at https://www.codesys.com/ or in the Codesys chat room https://forum.codesys.com/
Benefit from the knowledge and information available from the Codesys Store. You'll find many examples of programs and solutions there, covering a wide range of tasks https://store.codesys.com/

Disclaimer

These examples are simply for the purpose of illustration. They cannot be used as the basis for any warranty or liability claims.