How to Optimise Electric Vehicle Powertrain Testing How to Optimise Electric Vehicle Powertrain Testing | HBM

How to Optimise Electric Vehicle Powertrain Testing

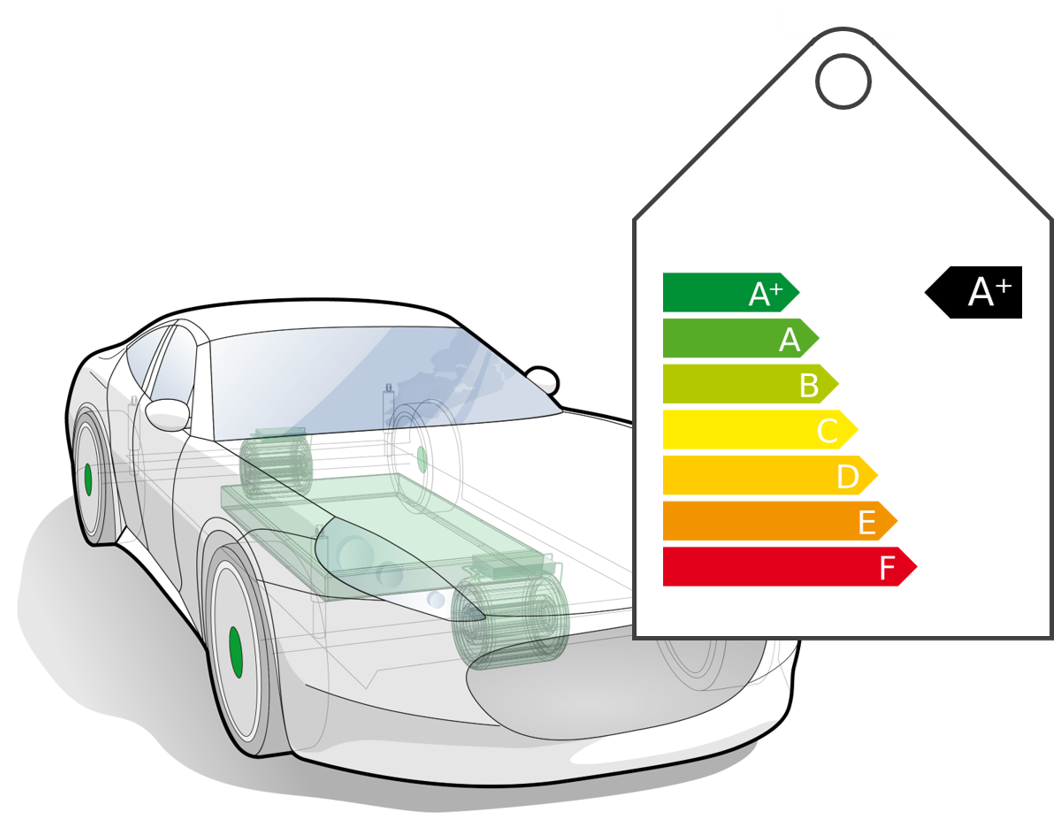
In the car dealer showroom, the sticker on a new electric vehicle tells the potential customer two essential bits of information: “energy consumption” (in Miles per Gallon E-equivalent) and “the range” (how far the driver can expect to travel until the battery needs to be recharged). For the driver, consumption means lower cost; and longer range means greater convenience.

Engineers in R&D see the same issues from a different perspective. They aim to achieve the highest efficiency by minimizing energy losses; for individual components, at the sub-systems level, and at the level of the entire vehicle.

The Basics of Electric Vehicle Testing

When Engineers examine the drivetrain, they consider more than just motor efficiency. Where do the energy losses occur? In transmission from the AC network to the battery? In the energy storage? In the conversion from DC battery back to AC again? In the inverter? Or the motor? Engineers seek to optimise the entire combination of battery inverter and motor that converts the electrical energy into mechanical power. Last but not least, they need to check that the motor controller, which regulates the communications between these three units, works correctly.

Difficulty of Calculating Electric Motor Efficiency

Calculating electric motor efficiency as the quotient of “electric power in” versus “mechanical power out” sounds easy. It’s not, because in practice such systems are highly dynamic. In fact, accurately measuring the power, and optimising the efficiency of inverters and electric motors under changing speeds and torque is one of the most demanding tasks in electric power testing.

Variables to Consider in Motor-Inverter Testing

The way these components cooperate impacts efficiency more than mere power. How do the individual components behave? How does that behaviour change under different circumstances (temperature, humidity) and in dynamic states (varying road conditions or driving styles)? And, of course, there are conflicting technical requirements like large bandwidths, a wide dynamic range and high measurement accuracies in a highly stressed EMC environment.

Physical Testing Vs. Computer Simulations

Computer simulations offer a theoretical indication of electric motor efficiency, but these need to be validated by extensive physical testing to make sure that calculated values match the evidence gained at the test bench - and that both reflect actual conditions in the real world. High-quality measurement data provides reliable insights that enable engineers to decide whether component, sub-systems or complete vehicles need to be validated by more testing, or whether they are ready to go into production.

The Growing Complexity of Electric Powertrain Testing

This is where the problem starts: the complexity within the component families is immense. Combining a powerful battery with an effective inverter and an efficient motor doesn’t automatically guarantee that a drive system is as efficient as it could be. Batteries range from 200-400 volts but can be as high as 600-800 volts. Inverter switches that operate at low frequencies will reduce losses, but they may become audible; higher frequencies result in higher losses and are limited by the physical switch sizes. Newly developed high frequency models are highly expensive and not yet robust.

Different Motor Types

The variety of electric motor types (permanent magnet, induction, wound field, or switched reluctance) multiplied by the range of motor sizes offers limitless possibilities. Still further complexity is possible through the use of multiple inverters, in effect creating machines with six or more phases. Each combination has its own individual benefits and downsides. Then comes the vehicle configuration: an electric vehicle can have between one and four traction motors, plus a host of smaller DC motors for auxiliary systems (windows, seats, etc.) all of which draw power from the batteries and impact the efficiency of the vehicle.

Differences Between Vehicles

Each individual vehicle is designed to meet a set of customer expectations that are clearly defined at the beginning of development. The expectations of a sports car driver, for example, in terms of range, comfort and driving behaviour are very different to the expectations of a small car driver. Testing must clarify whether the actual performance fails, meets or exceeds expectations for efficiency, losses and behaviour in each case.

Manufacturing Quirks

At the same time, motor manufacturers aim to balance design requirements against economic criteria. In addition to the unit cost of production, they also seek to reduce the effort invested in R&D via shorter test cycles and faster time-to-market.

The Need for Custom Powertrain Testing Workflows

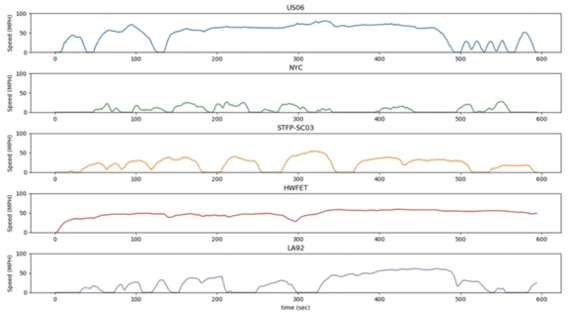
Since there are hardly any standards for tests in the field of electromobility, every test set-up is adapted to the individual components under test. As every vehicle must be able to handle constant speed and load changes as well as load conditions (road conditions, drive styles, battery condition or ambient conditions like temperature and weather), these parameters need to be considered in the test set-up. As we have seen above, the scenario becomes even more complex for vehicles with not just one motor deriving a single axle, but at several axles with several motors. This level of complexity multiplies the number of measurements and the volume of data to be collected is expands in proportion.

Add to that the complex and time-consuming test bench build which is usually highly customized. Timely coordination and planning are therefore essential to ensure that deadlines for ensuing development steps up to series production will be met. To this end, all parts of the test bench must mesh smoothly. What can be done to meet all these requirements at the same time? The answer is to choose test bench equipment that seamlessly integrates into the test bench system; that is not only accurate, but also increases engineer productivity while supporting the need to deliver auditable results for validation and certification.

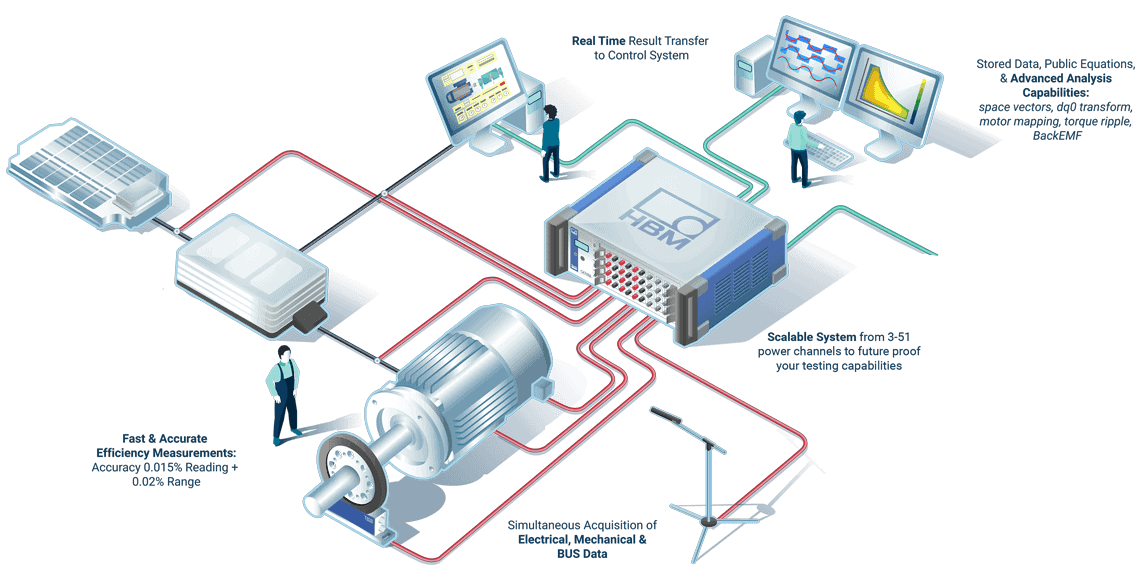
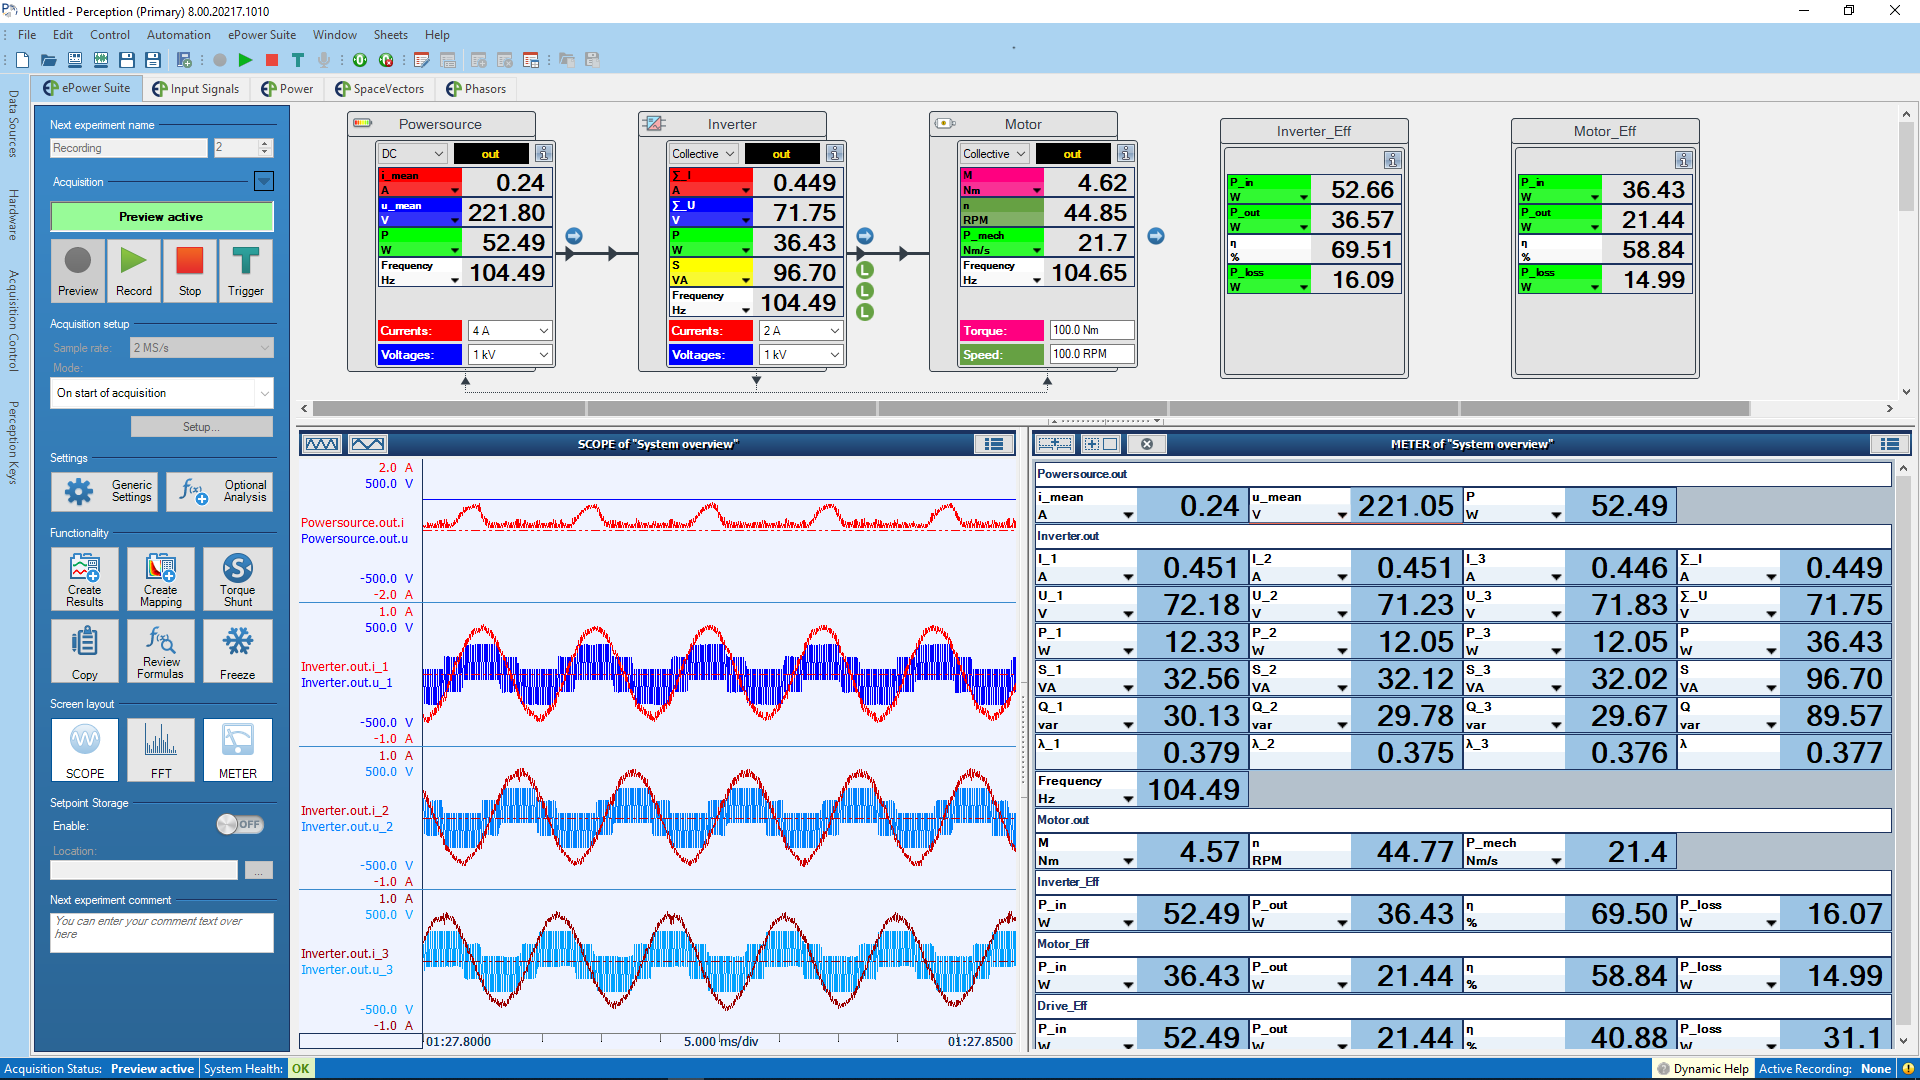
Figure 5: The eDrive solution from HBM covers the entire measurement chain: high-precision sensors, powerful instruments and intuitive software. Mechanical signals (e.g. torque) and electrical signals (current and voltage) are acquired simultaneously and help engineers to better understand the electrical drive and its losses faster and more accurately than ever before.

Click Here For Your eDrive Brochure

HBM’s eDrive Testing Solution

The HBM eDrive Testing Solution consists of durable, reliable hardware, advanced software and highly precise sensors that are designed for perfect interoperability. The solution lends itself perfectly to the task of testing e-drive efficiency and is capable of handling electrical, mechanical, control, and NVH signals alike.

The modular, flexible set-up enables engineers to adapt the test bench to small or high input channel count. For dynamic power measurement, up to 51 input channels can be handled simultaneously at high sampling rates and the highest possible accuracy. Channel density is achieved by adding as many power cards as needed to the portable or tethered GENESIS HighSpeed Power Analyzer mainframe – or by combining several Power Analyzers. The three-channel GEN310B power card, for example, features an outstanding accuracy, a 2MS/s sampling rate and optimum efficiency calculations. Its voltage inputs range up to 1500 V DC, thus covering even the most demanding electric vehicle testing applications, while delivering best-in-class 1000 V CAT IV safety rating. Since temperature is one of the critical factors of electric motor efficiency (the cooler the motor, the better the efficiency), universal cards are also available to perform measurements at lower sampling rates. Combining both card types in a single power analyzer is not a problem. Most importantly, all signal acquisition – electrical or mechanical – is synchronised on a single timeline based on the PTP v2 standard. No need to worry about the time stamp of your readings.

The system simultaneously acquires and stores raw data, thereby significantly reducing the time needed for testing. Even if the engineers decide to add measurements at a later stage, there is no need to re-run a test. All data is available to solve the problem mathematically.

This time-saving effect is enhanced by real-time calculation and visualization of the results in the Perception software. Live oscilloscope and FFT displays enable engineers to review their tests while they are being set up, thus saving a significant amount of time that would be needed for adjustments after the tests are run. Perception not only provides a complete analysis toolbox, but also allows for adding custom calculations. This gives the user full flexibility and data transparency. Perception is also used to configure triggers for an event-based data recording.

Last but not least, the HBK solutions for electric powertrain testing integrate seamlessly into any test bench automation system and allow for remote test control through software interfaces like API, CAN FD or EtherCAT. 

HBM’s eDrive Testing Solution contributes to a shorter testing preparation time, quicker testing, fewer test cycles and ultimately a significant cost-reduction in new vehicle development.

Accuracy and Speed

Frontloading the development cycle because of time and budget restraints also implies that engineers need simultaneous capture of as many data signals as possible. In the early stages of new vehicle development there may be very knowledge about the interoperability of the electronic drivetrain components – in particular the combination of inverter and motor. In practice, this translates into measuring as many signals as possible and storing the data – just to be on the safe side. To characterize the drive components, the scope of signals to be acquired encompasses:

  • DC current and voltage between battery and inverter
  • 3-phase AC current and voltage between inverter and motor
  • Torque and speed as the conversion of electrical into mechanical energy
  • Battery temperature, inverter temperature and motor temperature
  • CAN bus (motor controller)
  • Ambient signals such as noise and vibration

to list just the most important ones. It is easy to imagine the amount of data generated by capturing these signals over a test period of days or even weeks is enormous.

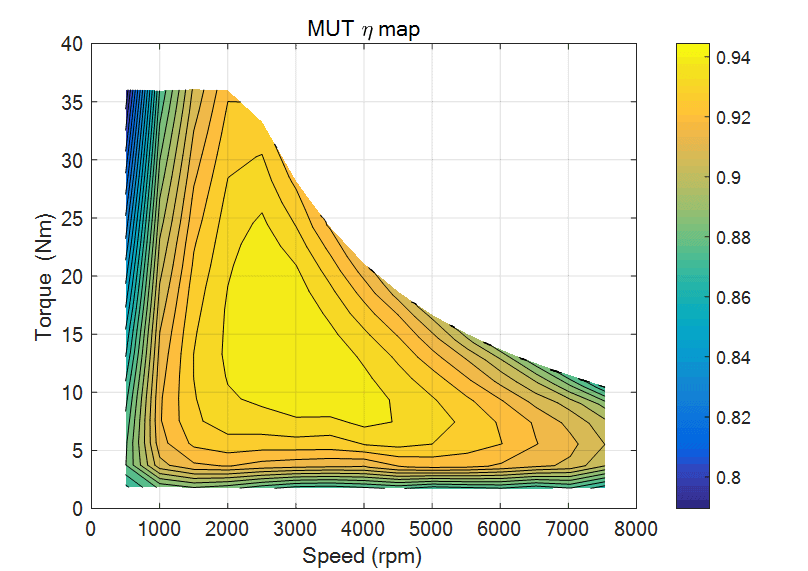
Rather than looking at the individual results, engineers will use efficiency maps to visualize readings and determine the efficiency of the individual components. These maps also help them to decide where to operate the inverter and the motor most of the time to achieve the highest efficiency and thus the longest range. Power is measured based on a pre-defined range of setpoints for torque and speed. Multiplying the measurements at these setpoints by various gear states (in case of a hybrid), by multiple temperature and / or battery states generates literally tens of thousands of measuring points. Series of experiments like these can take days or weeks to run. Simultaneous capture of all relevant signals ensures that test data is available for post-processing and offline analysis. This approach also provides the auditability required for both internal documentation and external validation of methods for certification.


HBM’s End-to-End e-Mobility Solution

HBM’s testing solutions for electric drivetrains use the so-called “cycle detect” technology to make efficiency mapping ten times faster. By accelerating the measurement time for individual set points to the range 0,5 to 1 second, the production of multi-dimensional efficiency maps can be cut from weeks to days or even hours. Since the raw data are available at any time, the engineer can reference previous tests if anything goes wrong – without needing to re-run the test series.

Another important factor comes into play here - accuracy: To achieve reasonable measurement uncertainty for derived values such as power loss or efficiency, only the most accurate power analyzer and the most accurate sensors will be good enough. Consider an inverter with a rated power of 500 kW input and 475 kW output which equals a loss of 25 kW. If the measurement chain error is 1%, the measured values are +/- 5 kW input, +/-4.75 kW output, giving a cumulative measurement uncertainty for energy losses of +/-9.75 kW – the cumulative measurement uncertainty of 39% is far from satisfactory. If, however, the measurement chain error is 0.1%, cumulative measurement uncertainty for the power loss is 3.9%. Obviously, the more accurate the equipment, the more reliable the test results, and the more meaningful the insights on motor calibration will be.

HBM’s high-precision Power Analyzer is complemented by a range of sensors for measuring voltage, current, torque/speed with best-in-class accuracy ratings and the highest safety standards. They are certified for e-drive test systems and perfectly blend into the GENESIS HighSpeed hardware for an integral solution.

A testing solution like HBM’s that continuously and reliably captures, stores, correlates, processes, and visualizes these data is indispensable to ensure fast, valid, auditable testing. Customized trainings, either on the HBM premises or at the customer’s site, ensure a speedy onboarding process. For training at the customer’s own leisure, a suite of self-learning courses are available at the HBM website or via the Internet. Our highly skilled engineers stand by to assist with knowledge transfer, system integration support and a suite of other services around the HBM electric motor testing solution.