Efficiency and Loss Mapping of AC Motors | White Paper Efficiency and Loss Mapping of AC Motors | White Paper | HBM

Efficiency and Loss Mapping of AC Motors

Recently electrical machines have become an important topic in many industries including power generation, heating/cooling, transportation and home appliances. With increases in efficiency standards and the increase in battery powered devices, the motor efficiency has become an important topic. This has only been amplified recently by the increased controllability of motors by inverters. Motors offer a highly controllable, efficient, and power dense solution to many of today’s needs. This shift to electrify all aspects of life has all resulted in the development of many research groups focused on increasing the efficiency of electric motors.

Download this paper as a PDF


The Test Rig

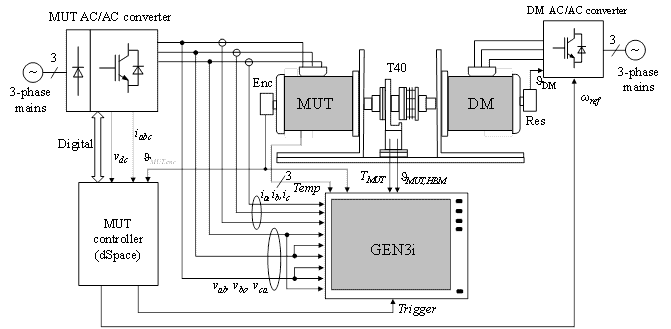
The test rig used for efficiency and loss mapping is shown in Fig.1. The test rig consists of the following main elements:

  • Motor under Test (MUT) is an Internal Permanent Magnets (IPM) motor
  • The motor controller is a dSpace board with a dedicated analog/digital interface
  • The Driving Motor (DM) is a speed-controlled Permanent Magnet (PM) motor fed by a bi-directional converter whose speed reference is provided by the dSpace board using an analog dSpace DAC (digital-to-analog converter) output. Another solution is to use a CAN or RS422 interface, depending also of the communication capability of the converter that supplies the DM
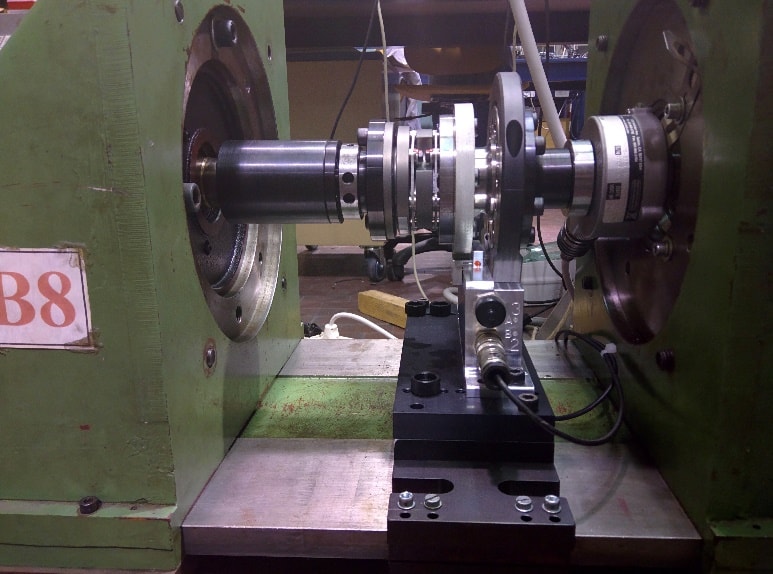
  • The torque is measured with the high accuracy HBK T40 torque sensor (Fig. 2) that provides the shaft torque and also the shaft position with a resolution of 1024 pulses/rev (encoder type outputs). The torque sensor is mounted as a mechanical coupler between the MUT shaft and the DM shaft. The data are transmitted to the measurement system by means of a rotating transformer.
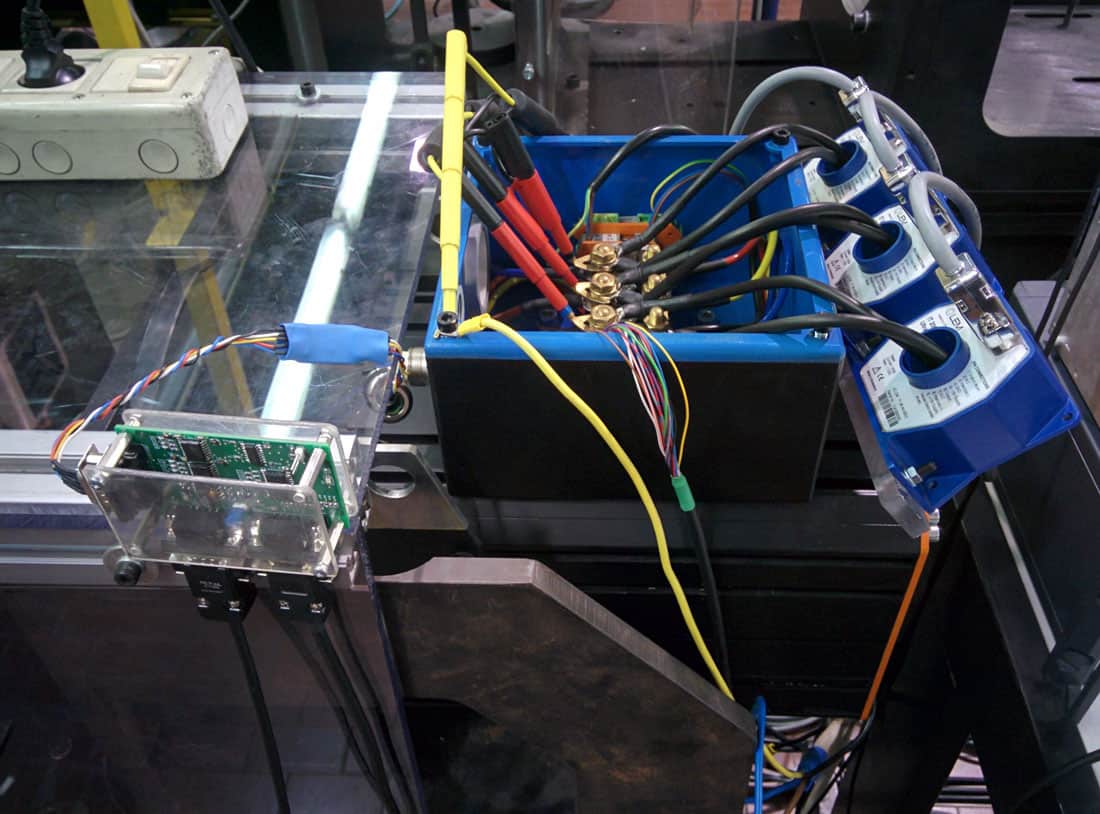
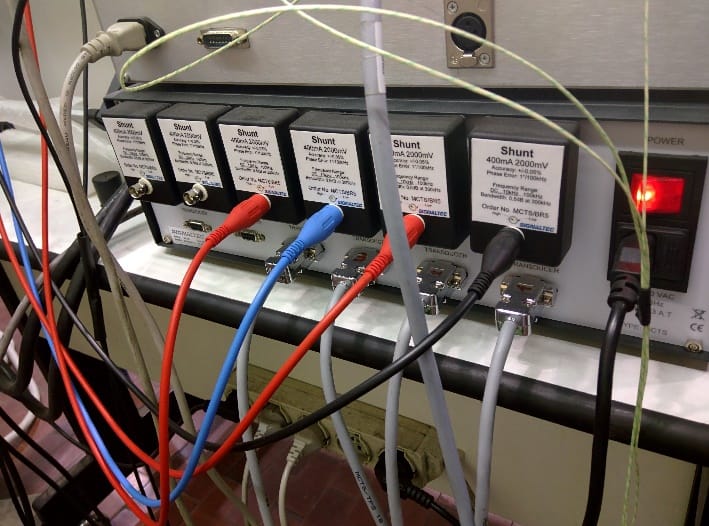
  • The phase currents are measured with high accuracy, external LEM sensors (Fig. 3) that are fed by a current sensor box that manages the current sensors and generates the outputs that are acquired by the HBK data recorder with the high-speed acquisition channels with a sampling rate of 2Msamples/s.  The voltage drops on the LEM shunts are sent to the Gen3i using BNC cables.
  • The MUT line-to-line voltages are directly measured by the Gen3i recorder using the high-voltage/high-speed acquisition channels with a sampling rate of 2Msamples/s.  In this way, the acquired voltages are the real PWM pulses that are applied to the machine.
  • Besides the rotor position provided by the T40 torque sensor, the Gen3i measures also the rotor position using an incremental encoder that is also employed by the motor controller (as shown in Fig. 1). An external splitter card receives the encoder pulses from the encoder and sends them to the motor controller and to the Gen3i with galvanic insulation.
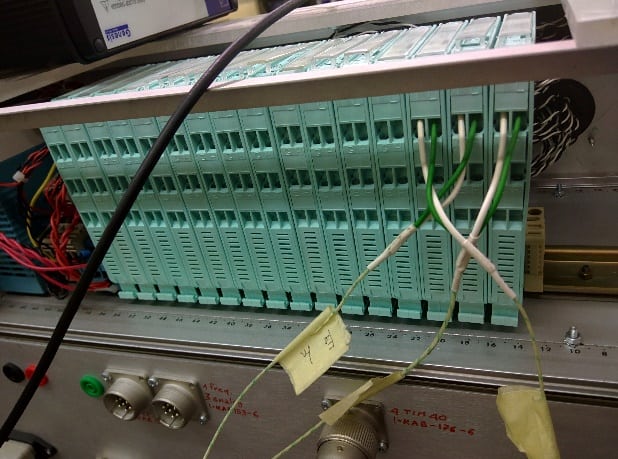
  • The motor temperature is measured by means of three thermocouples. The thermocouples are read by programmable isolation amplifiers (Fig. 4) whose outputs are provided to a low speed acquisition card of Gen3i.

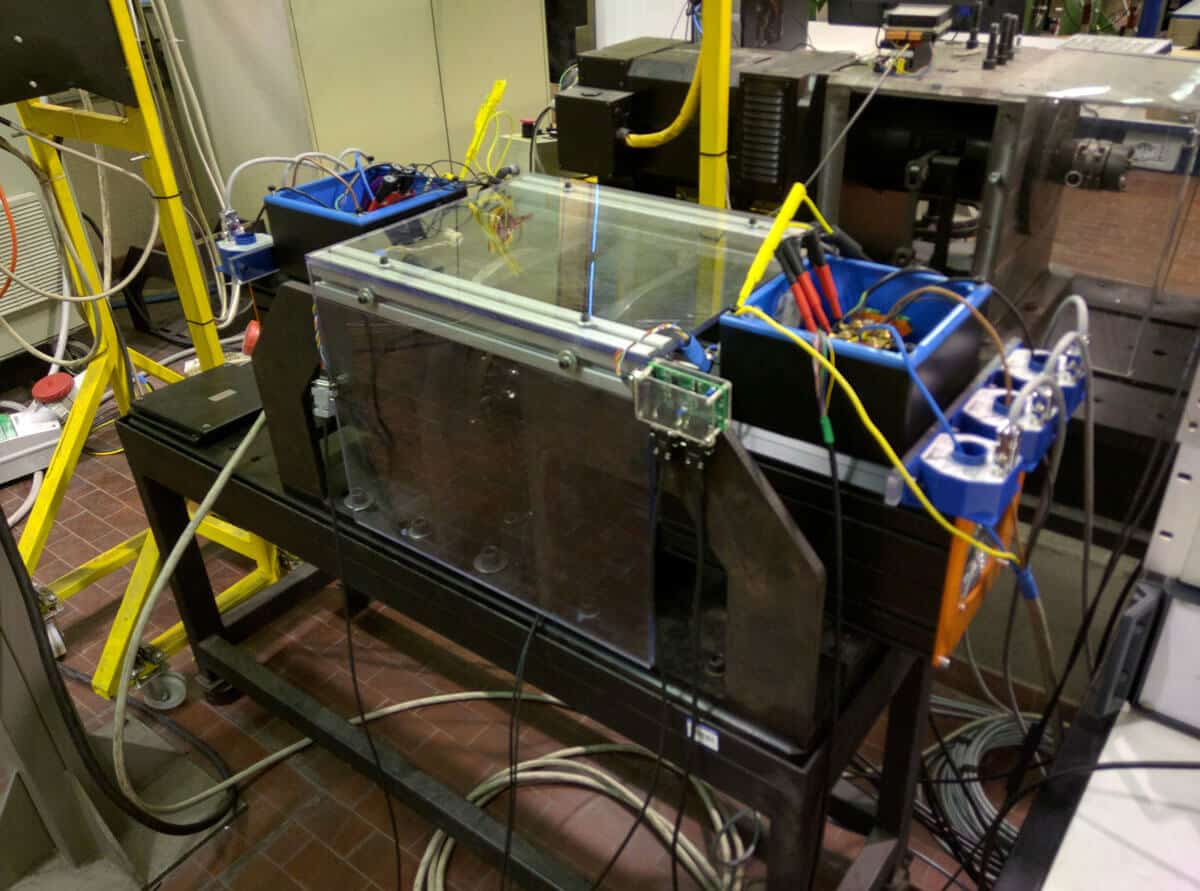
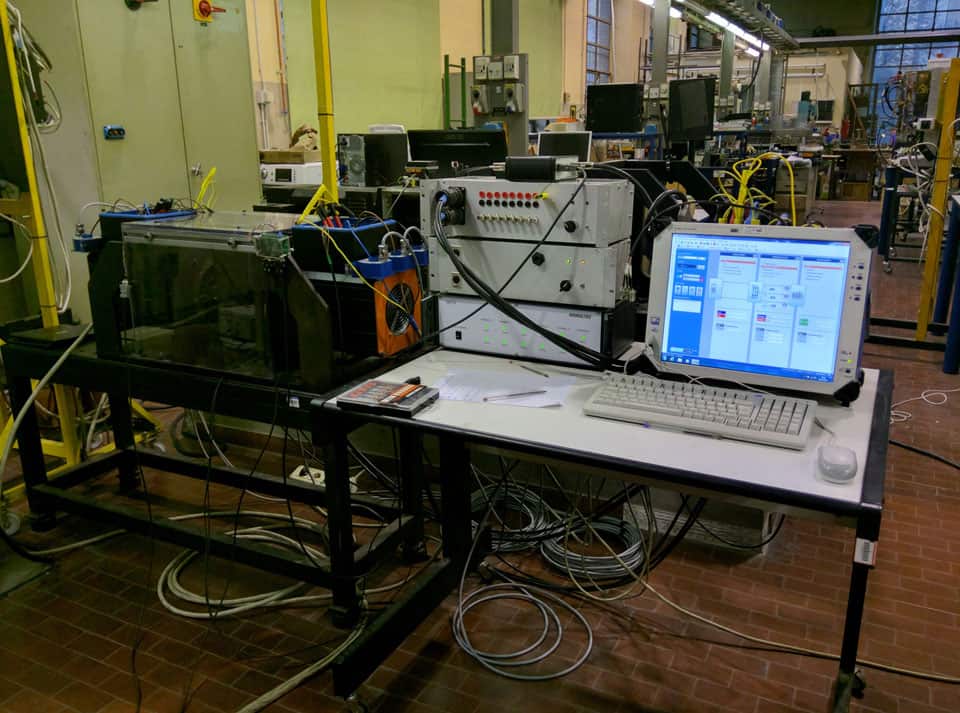
The MUT and DM are shown in Fig. 5, while Fig. 6 contains a general view of the entire test rig, including the HBK Gen3i data recorder. 


Efficiency and Loss Mapping Identification Procedure

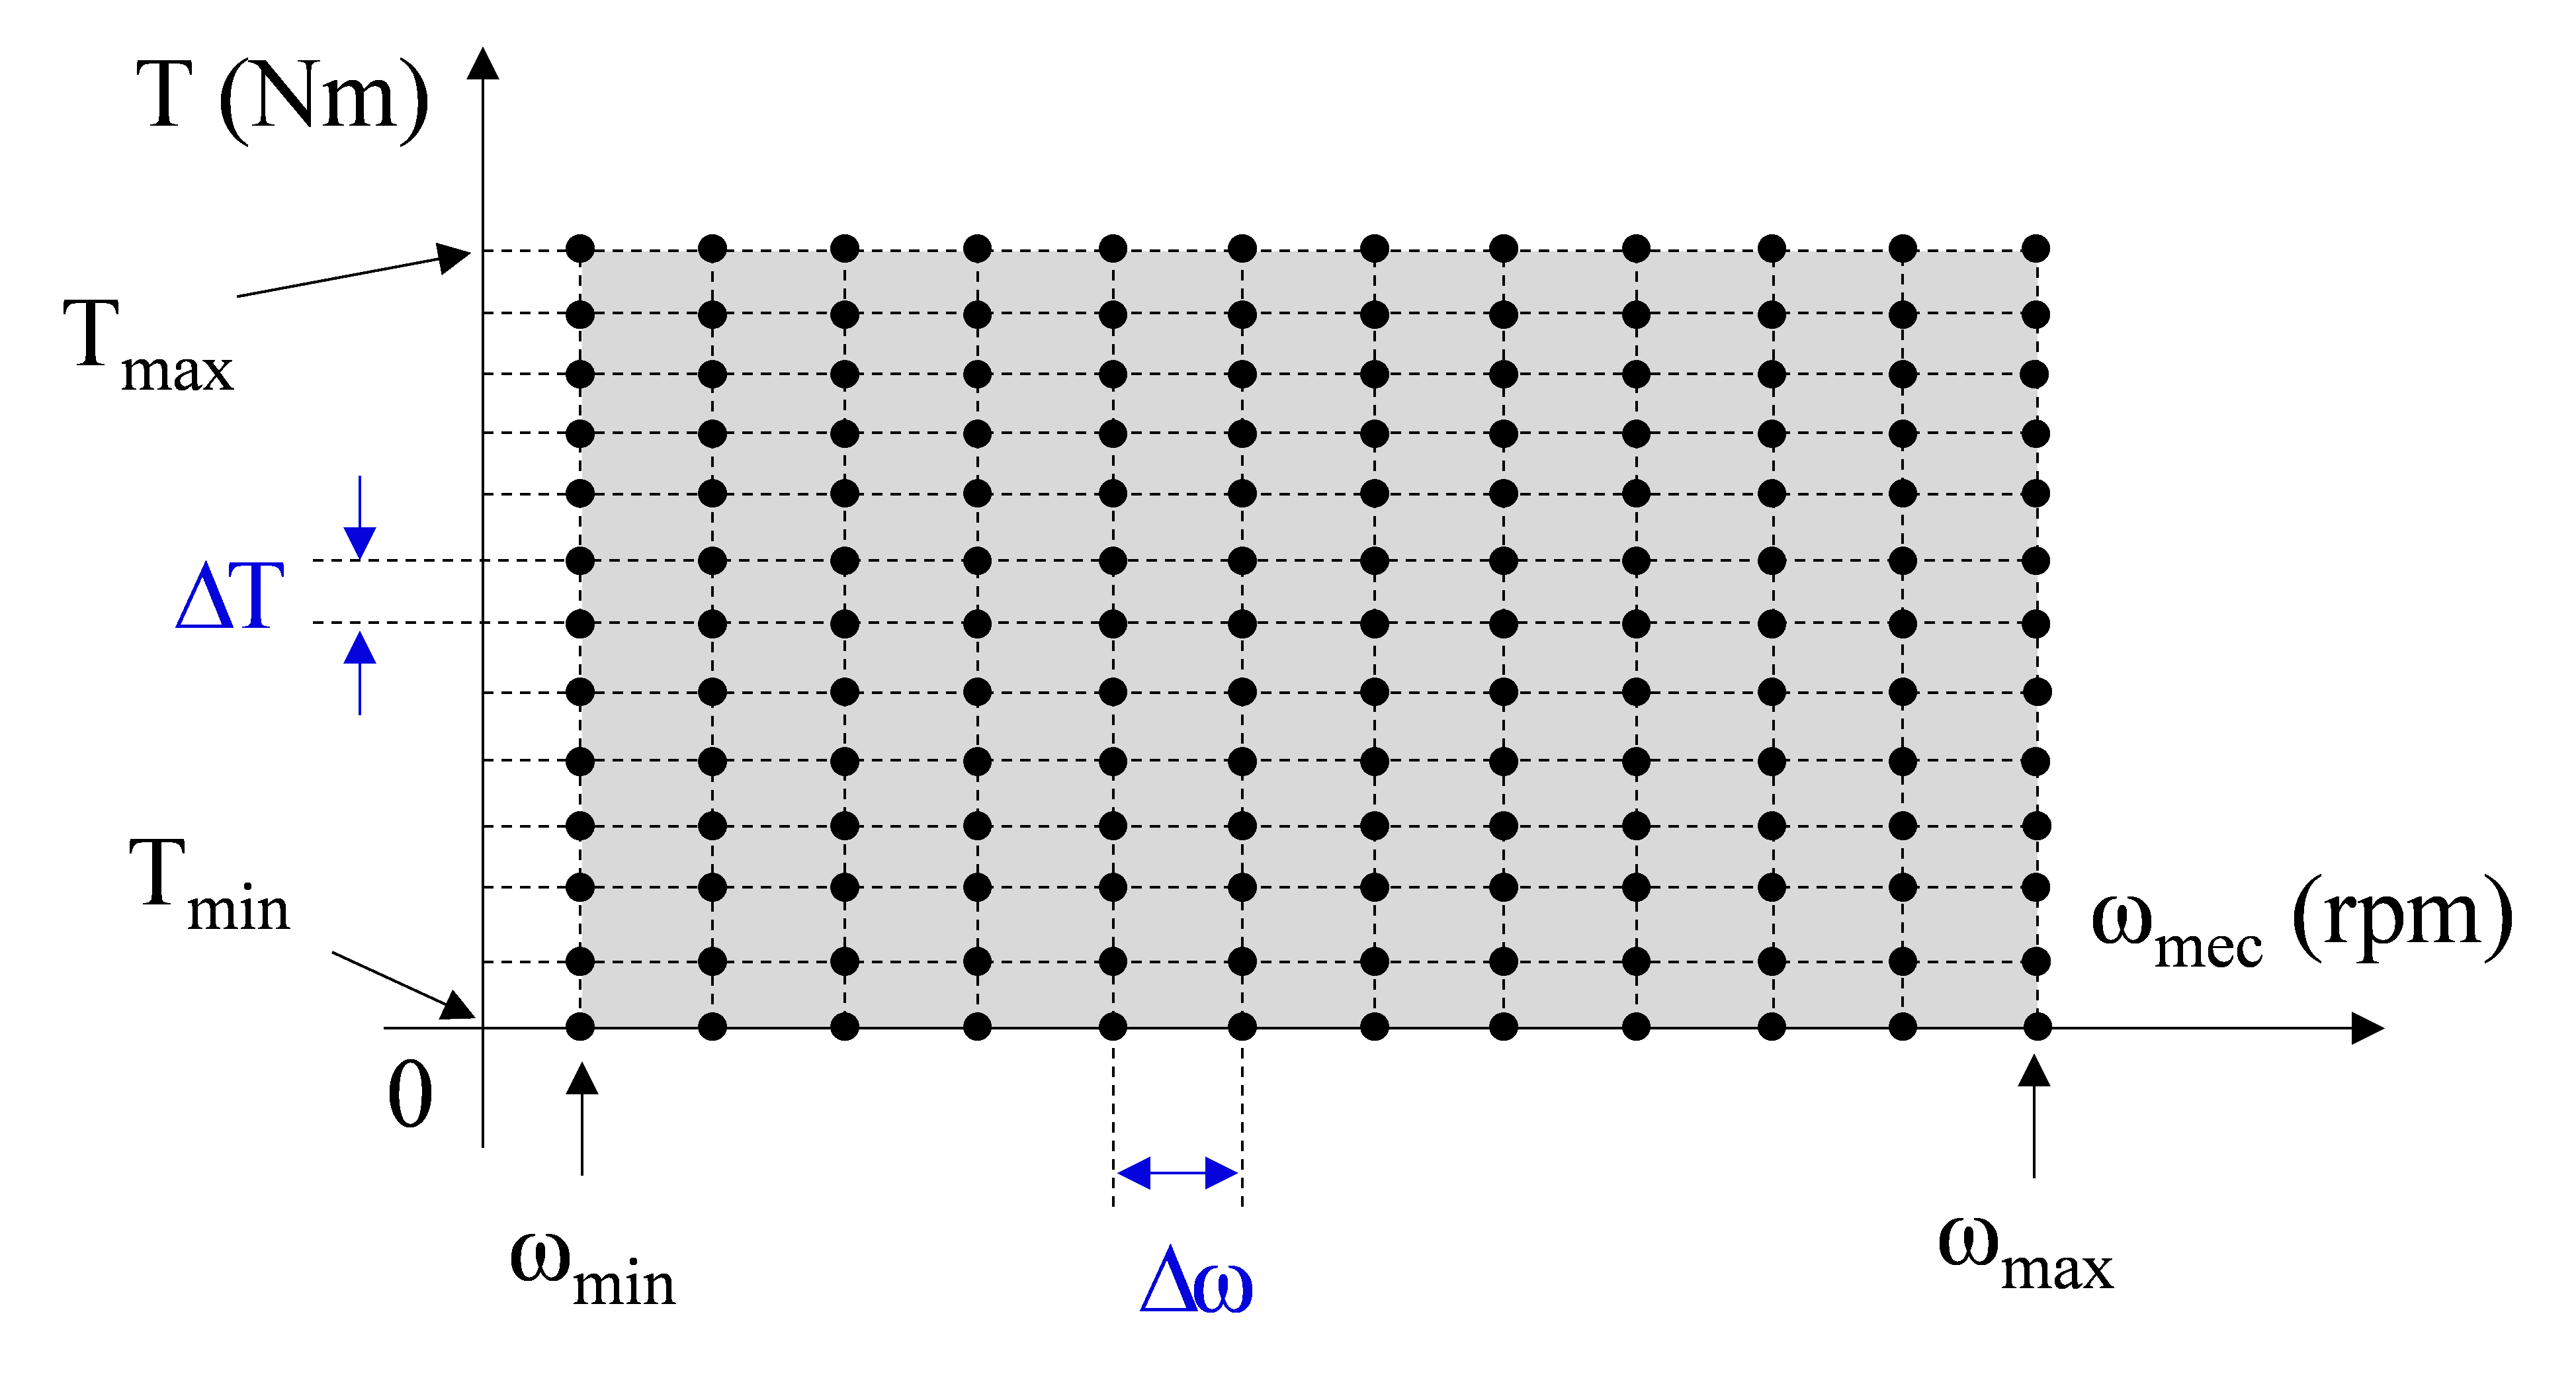
The idea is to sweep the entire torque-speed plane by creating a mesh of reference operating points that are shown in Fig. 7.

The speed is changed between a minimum value (ωmin) and a maximum value (ωmax). The speed range (ωmax-ωmin) is divided into equal intervals of length Δω that is properly chosen to get a reasonable number of points n (10 to 20). For each speed, the torque is changed between a minimum value (Tmin) and a maximum value (Tmax) with steps of ΔT that is properly chosen to get a reasonable number of points m (10 to 20). As a result, the mesh in the torque-speed plane contains N = n x m points.

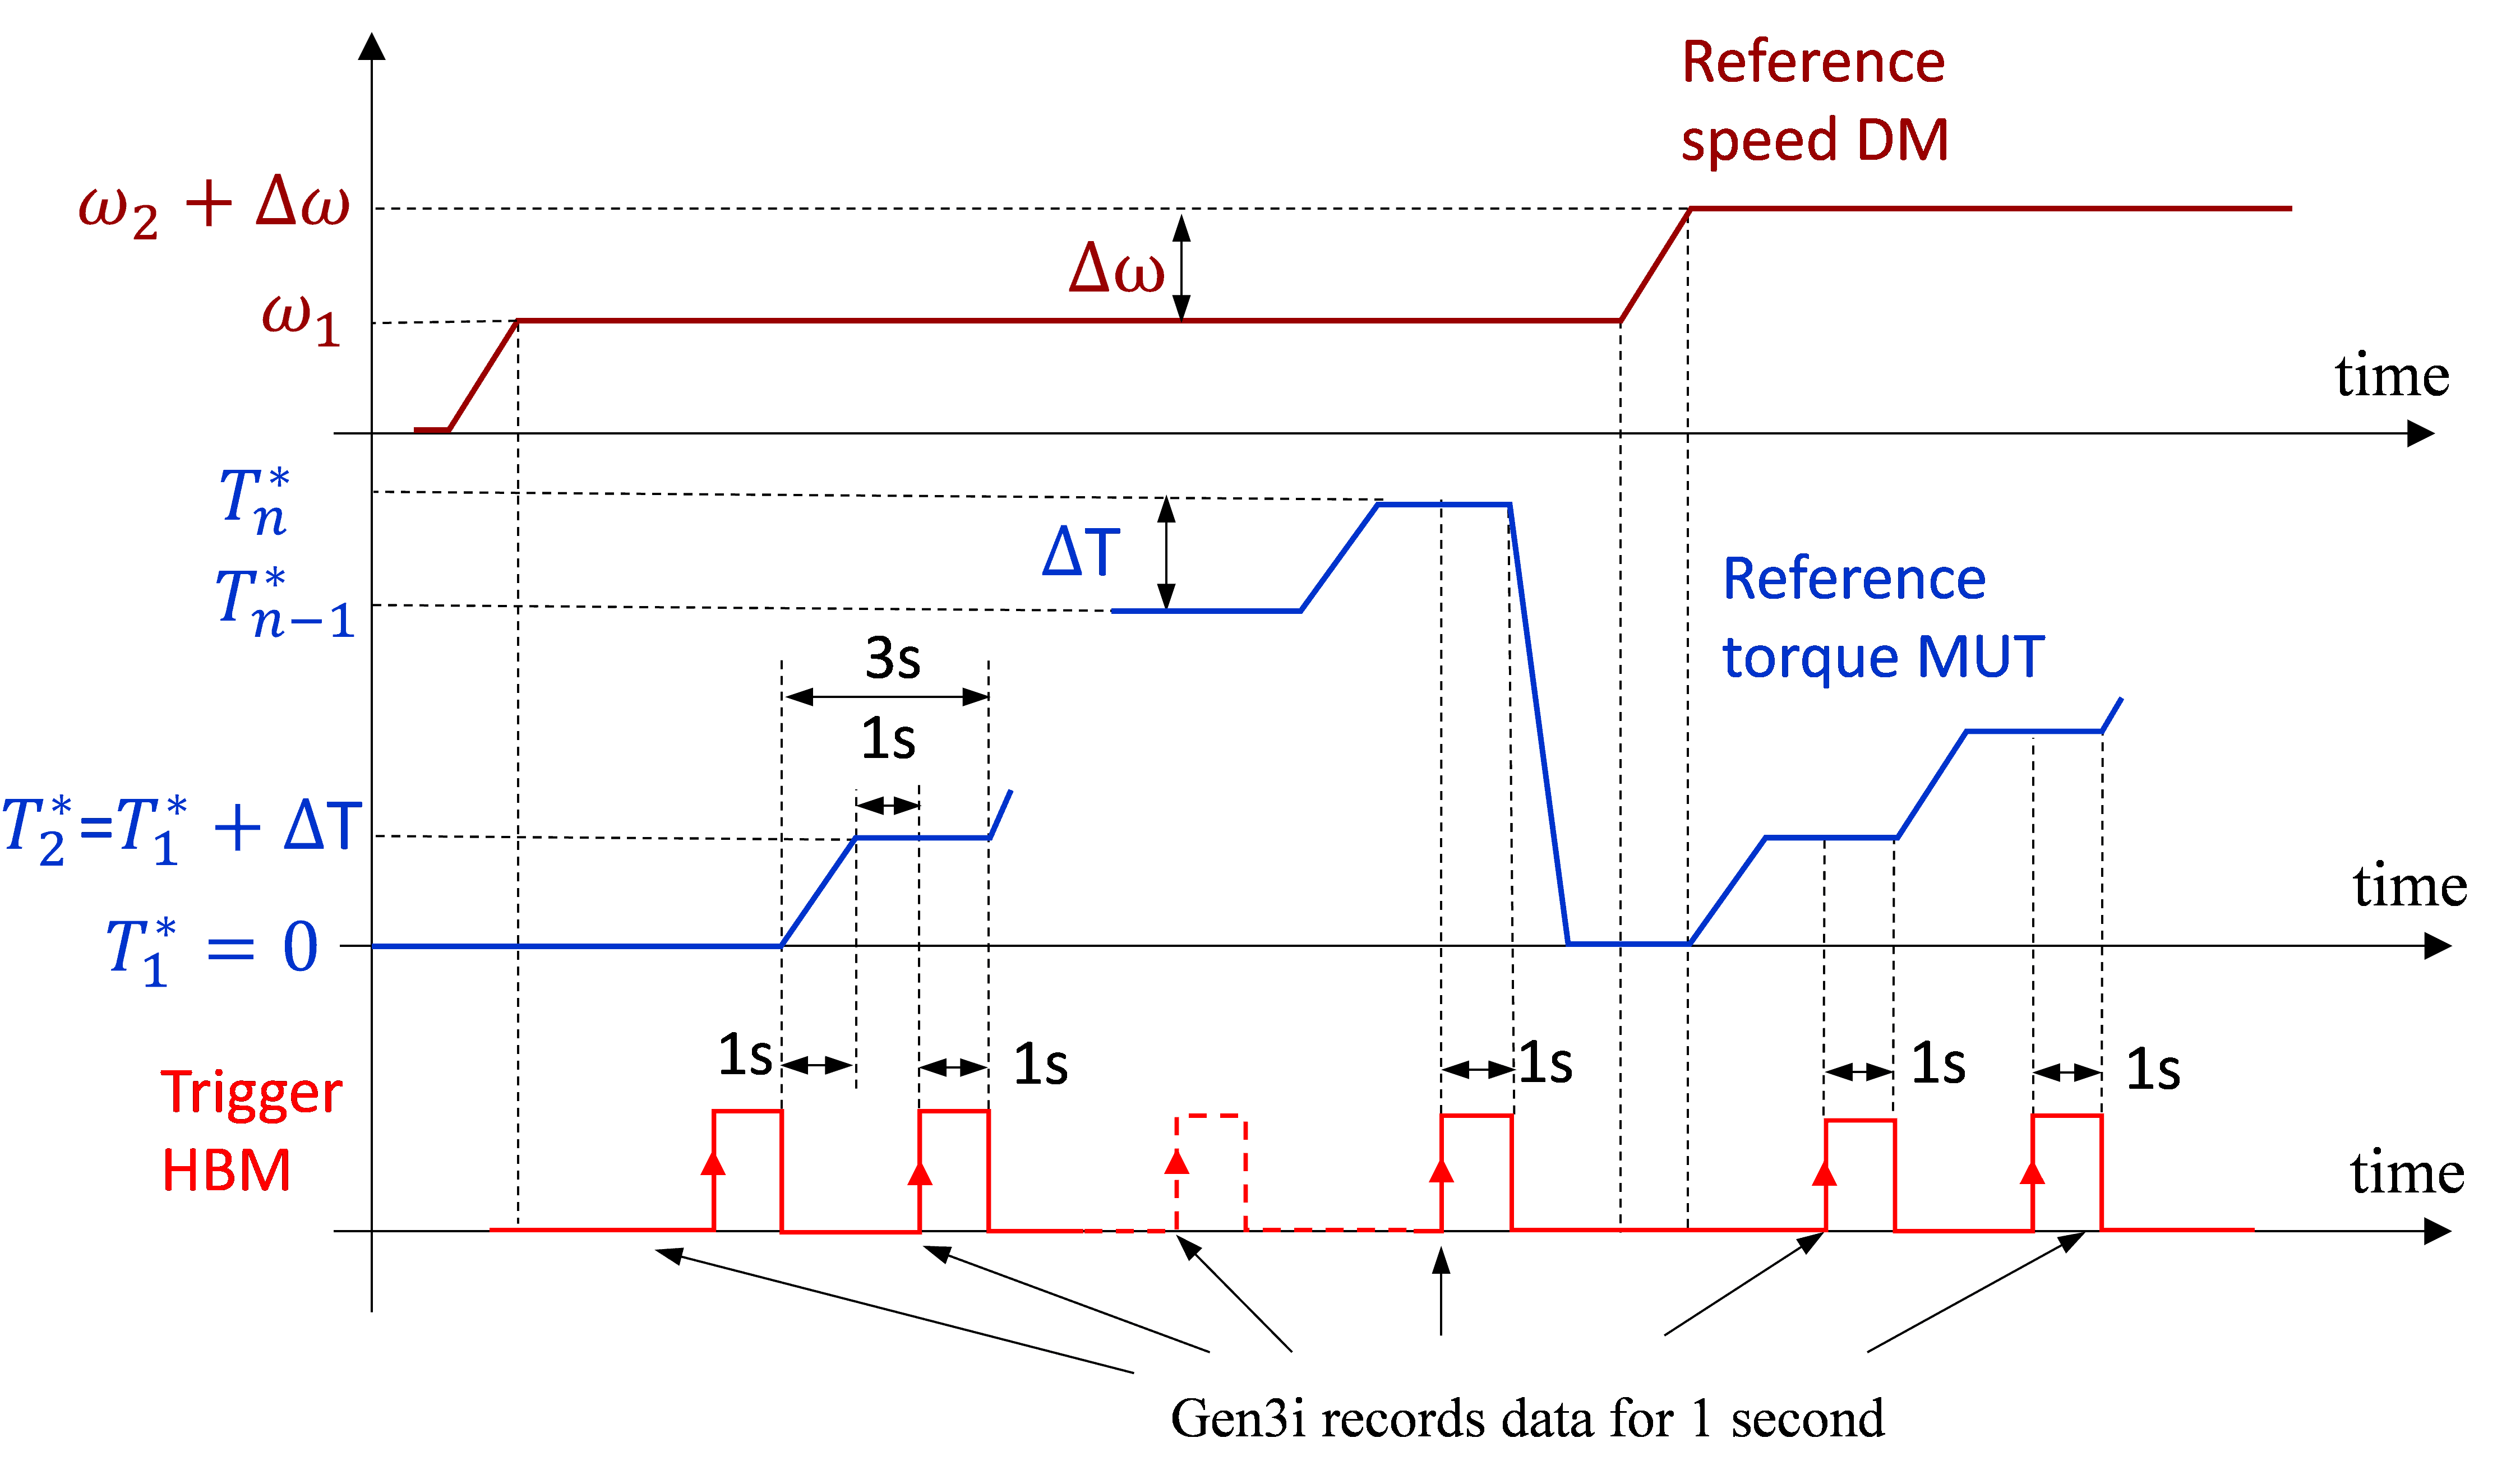
The DM is speed controlled and provides the speed for one operating point, while MUT is torque controlled. For each operating speed, the torque is changed with steps of ΔT between Tmin and Tmax, as shown in Fig. 8.

As shown in Fig. 8, one operating point lasts 3 seconds. The motor controller generates a TTL-compatible trigger signal for the HBK data recorder that must store data for 1 second when a rising-edge trigger is detected. The entire procedure lasts about 10 to 20 minutes, according to the chosen number of operating points.


Computations after the Test

Once the test is finished, the Gen3i stores a big data file that can be easily split in N data files, where one file corresponds to one trigger, i.e. one operating point in the torque-speed plane. For each operating point, the Gen3i performs the following computations:

Input electrical power

(1)      

where the vαβ and iαβ are the voltage and current (α,β) components in stationary reference frame, T is the electrical cycle (period) obtained from the electrical angle.

It must be mentioned here that no filters are applied to the acquired voltage and currents.

Copper (Joule) losses

(2)      

The average stator resistance  Rs,avg is calculated as

(3)      

where Rs,base (Ω) is the stator resistance at base temperature (as example, θbase=20 °C) and  is the average stator temperature computed as the mean value of the k measured stator temperatures.

The average resistance can be corrected to take into account the skin effects.

Mechanical shaft power

(4)      

Where Tm is the measured torque and the ωm is the measured speed.

Iron and mechanical losses

(5)      

Iron loss

(6)      

where PMec are the mechanical losses that are speed dependent and that must be known in advance.

To avoid any influence of the torque ripple generated by both DM and MUT (with consequences on the speed), all the power values are saved as mean values calculated over a time interval containing a multiple number of mechanical revolutions.

Torque corresponding to the iron loss and to the total loss (iron + mechanical)

(7)       

The torque calculated with (7) should be the difference between the estimated torque (by the motor controller) and the real shaft torque. The torque values calculated with (7) are provided by the Gen3i as average values over an integer number of mechanical revolutions.

MUT efficiency and inverter efficiency

(8)      

The inverter efficiency can be obtained only if the DC link voltage and the DC link current are measured. In this case, the inverter efficiency will be

(9)      

where  is the input inverter power that must be averaged for eliminate any ripple in the DC link voltage and current.

Besides the efficiency and loss mapping, the Gen3i calculates and saves the following quantities that are extremely useful for the analysis of the MUT operation:

(A) (d,q) rotor frame flux linkages

The flux linkages are computed first in stationary (a,b) frame as time integral of the back-emf voltages:

(10)      

An offset correction is necessary for each electrical period (cycle) to avoid the drifting of the computed flux linkage components. Once the (a,b) components are calculated, the (d,q) components are easily obtained with the rotational transformations; the magnitude of the flux linkage is also calculated.

(11)      

where  is the electrical position that is calculated from the measured mechanical position, the pole-pairs number and an offset that must be known.
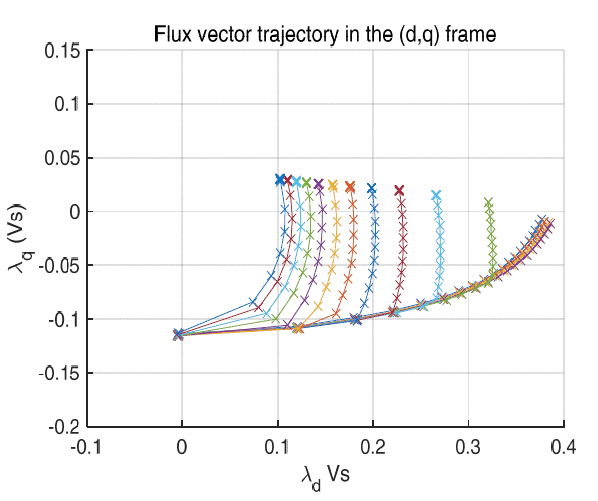
Since the stator flux linkage components are calculated using the real motor voltage and a very good stator resistance, it is assumed that the precision of this computation is very good. In this case, the trajectory of the stator flux vector in the (d,q) plane can be obtained with very good precision and can be compared with the results coming from the magnetic model.

(B) (d,q) stator currents and voltages

The (d,q) rotor frame voltage and current components are calculated from the (α,β) components using the direct rotational transformation (8) that is used also for the fluxes. Since the (d,q) voltage components are affected by the PWM ripple, their mean values are extracted for each electrical cycle and also for an integer number of mechanical revolutions.

The trajectories of the stator current vector in the (d,q) plane are useful to check the MTPA trajectory below the base speed.

(C) Estimation of the electromagnetic torque

The electromagnetic (or air-gap) torque can be computed by the Gen3i as

(12)      

This electromagnetic torque is computed with flux components that have been evaluated by sampling the real motor PWM voltages and with a stator resistance that takes into account the measured average stator temperature. Therefore, this torque can be defined as the best torque estimate.

The Gen3i saves the electromagnetic torque as a mean value calculated over an integer number of mechanical revolutions.


Experimental Results

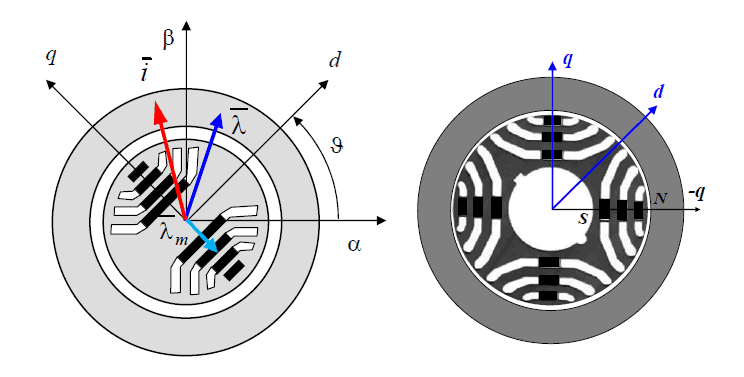
The above-described procedure has been applied for a PM-assisted synchronous reluctance motor having the following rated parameters: rated voltage (line-to-line) 310Vrms, rated current 17Arms, rated torque 22Nm, rated speed 3250 rpm, 4 poles. The definition of the rotating (d,q) reference frame uses the approach used for synchronous reluctance machines, as shown in Fig. 9.
The d-axis is the minimum reluctance axis, while the q-axis is the maximum reluctance axis. The magnets flux linkage vector is aligned with the negative q-axis.

During the testing procedure, the speed is changed between 500 rpm and 7500 rpm with steps of 500 rpm (15 speed points), while the torque is controlled between zero and 38 Nm, with steps of 2 Nm (20 testing points). As a result, the mesh of operating points in the MUT torque-speed operating plane (Fig. 7) has 300 testing points.
The inverter that supplies the MUT is a standard IGBT inverter whose switching frequency has been set at 10 kHz. The inverter has been supplied with a constant DC voltage of 350Vdc that was provided by a constant DC voltage source of 340Vdc.
The obtained results are described in detail in the next subsections.

(A) Torque-speed and power-speed maps

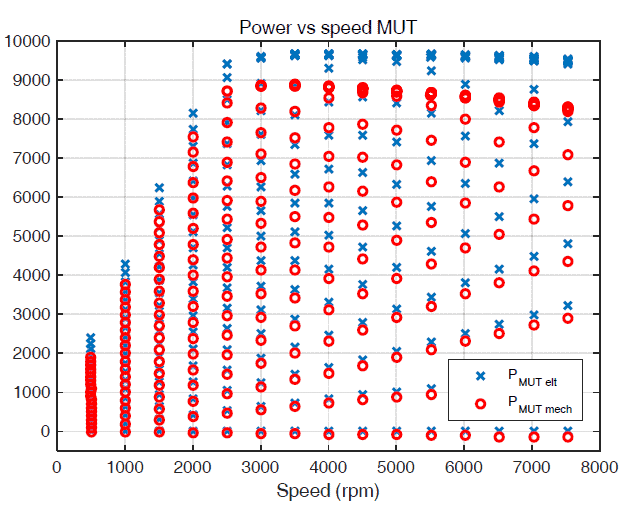
The measured torque-speed map is shown in Fig. 10, demonstrating the MUT torque capability. The maps of the input electrical power and the output mechanical power speed are illustrated in Fig. 11. At high speed operation, the input electrical power is almost constant, while the output mechanical power is slightly decreasing. This figure allows defining the constant power speed range given the target output power. From Fig. 11 one can see that the constant power speed range is about 1:3.
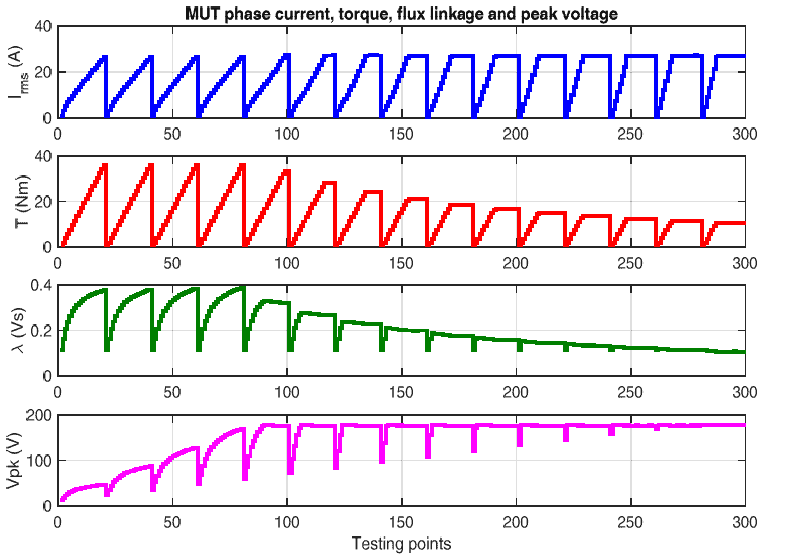
The rms phase current, the measured torque, the total flux linkage and the peak phase voltage are shown in Fig. 12 for the whole test. Fig. 12 is very useful since demonstrates that the total phase current is limited during the entire test. Moreover, it is very clear how the phase voltage is also limited at flux weakening and the flux is progressively reduced as the speed increases.

(B) Efficiency and loss maps

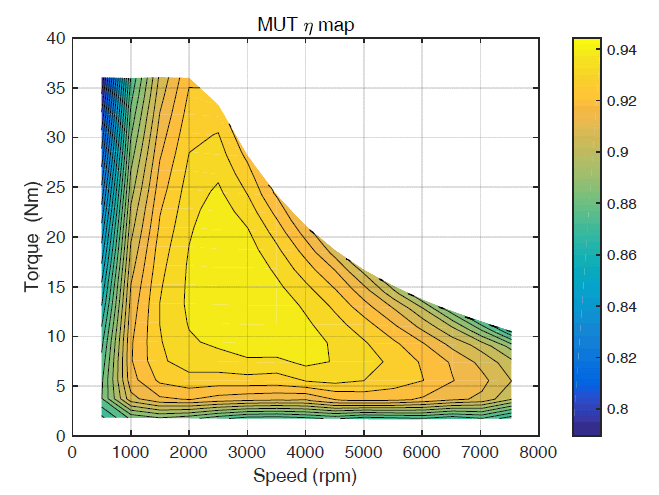
The efficiency map of the MUT is shown in Fig. 13, while the loss map is shown in Fig. 14. The efficiency map is extremely important to evaluate the motor efficiency for the entire torque-speed range. If necessary, the Gen3i can measure the inverter DC input power and consequently the inverter efficiency map and thus the drive efficiency map can be derived.

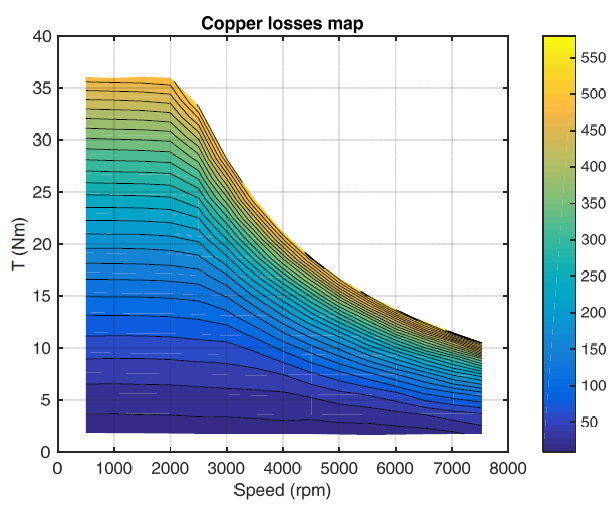
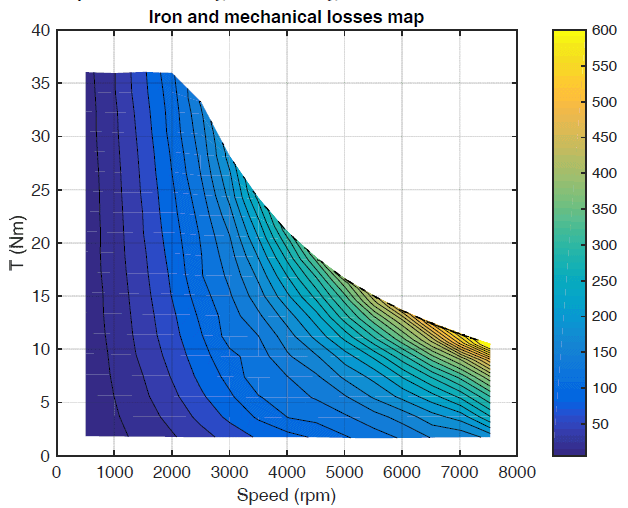
The copper loss map is provided in Fig. 15, while Fig. 16 contains the iron and mechanical losses map.
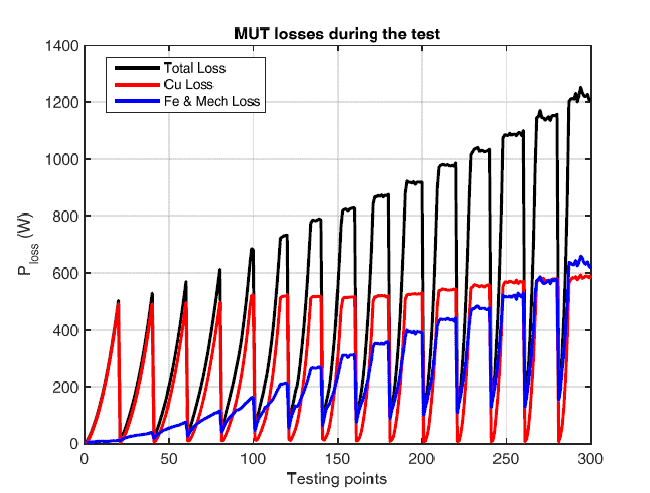
The time variations of the different MUT losess (copper loss and iron and mechanical loss), along to their sum (representing the total losses), are shown in Fig. 17. This result is very interesting since it shows that the copper losses are dominant up to 3500 rpm (testing point 140), while above this speed the iron and mechanical losses become important and they are equal with the copper losses at 7000 rpm. This result totally agrees with the individual loss maps shown in Fig. 15 and Fig. 16.

(C) Trajectories of (d,q) variables

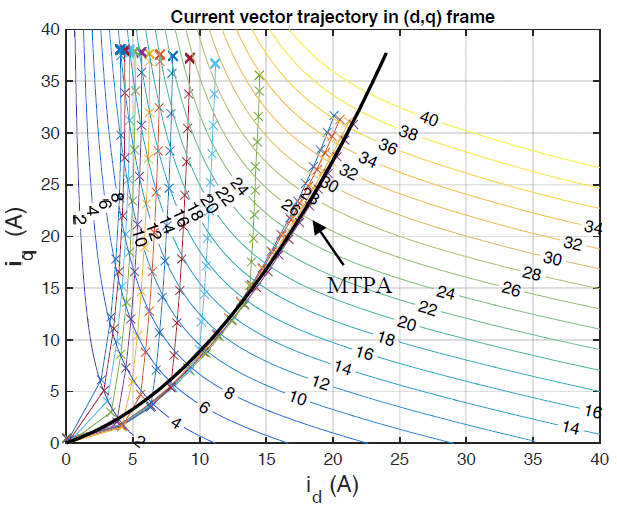
The study of (d,q) variables allows a proper verification of the machine control. Using the measured rotor position, the GEN3i can easily obtain the (d,q) quantities (currents, voltages, flux linkages) to plot the trajectories of the corresponding vectors in the (d,q) frame during the test. As example, Fig. 18 shows the trajectory of the currents vector during the test, while Fig. 19 contains the trajectory of the flux linkage vector during the test. At low speed, both current vector and flux vector follow a trajectory (solid black line) that corresponds to the Maximum Torque per Ampere (MTPA) operation. At flux weakening, the current vector and the flux vector leave their optimal MTPA trajectories and approach the q-axis. The current vector keeps constant the maximum amplitude since the current is limited, while the stator flux vector amplitude is reduced, as should happen at flux-weakening operation.
The results from Fig. 18 allows checking if below the base speed the measured current vector really follows the MTPA trajectory to exploit in an optimal manner the MUT torque production.