PCB기판의 스트레인 측정 방법 PCB기판의 스트레인 측정 방법 | HBM

인쇄회로기판(PCB)의 변형 및 변형률 측정

1. PCB 변형률 측정의 수행 이유

일상생활에서 우리 각자는 자동차, 스마트폰, 비행기 및 수 많은 전자 부품을 사용합니다. 이러한 많은 제품에는 인쇄회로기판(PCB)이 필수적인 요소 입니다. 복합적 전자제품 및 전체 전기 시스템의 신뢰도는 경험 기반의 설계 및 집중적인 시험의 결과입니다.

PCB는 제조 과정뿐 아니라 운송 및 작동 과정의 기계 및 열 충격(예: 변형, 남용, 진동, 충격, 열 노출)에 노출됩니다

PCB의 제조 과정에서 다음 고장 및 응력이 발생할 수 있습니다.

  • 커넥터, 파워 레일, 냉각 플레이트, 접촉 핀, 납땜 터미네이션 또는 배터리 홀더 설치 중 휨 응력
  • 표면 실장 소자(SMD), 표면 실장 기술(SMT), 삽입 실장 소자(THD), 삽입 실장형(THT) 및 핀인홀(PIH) 피팅의 실장 중 파손
  • 볼 그리드 배열(BGA)이 있는 납땜 포인트의 제거 및 응력 균열
  • 분리 시 일시적인 응력 피크(분리 시 임계 변형/전단 변형의 결정)
  • 압입, 나사 조임 또는 하우징 내 캡슐화 처리로 인해 발생하는 기계적 응력(변형) 증가
  • 다른 처리 단계에서 높은 휨 응력으로 인한 SMD 커패시터 파손
  • ICT 시험 중 시험봉에 너무 많은 힘이 인가됨

운송 및 작동 과정에서 다음 충격으로 인해 고장이 발생할 수 있습니다.

  • 기계적 부하(정적)
  • 진동 및 충격(동적)
  • 열팽창으로 야기된 균열을 초래하는 열적 효과(하우징의 상이한 α 값, 히트 싱크, 인쇄회로기판, 전자적 구성요소)
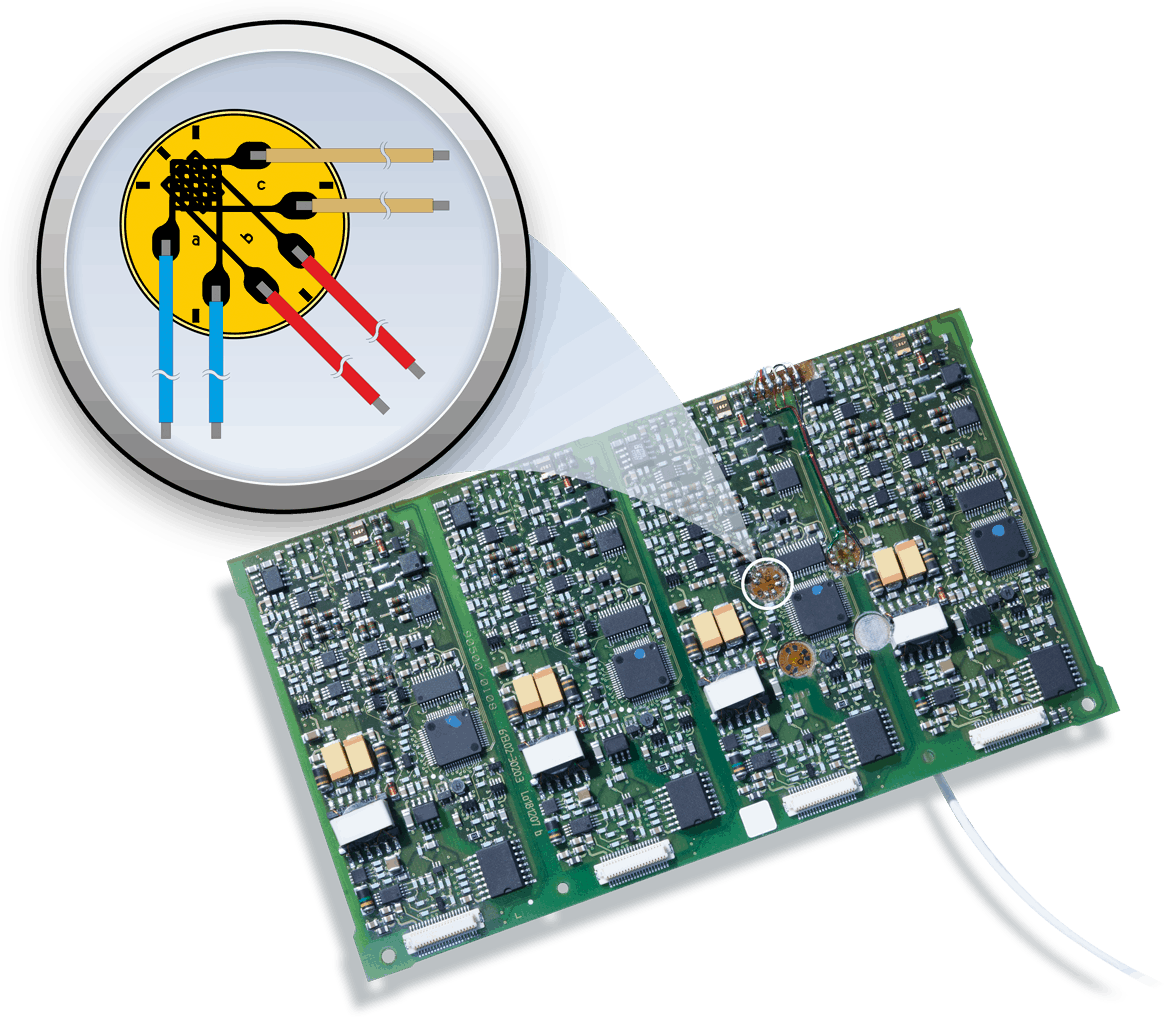
이러한 모든 효과는 구성요소의 완전한 고장을 야기할 수 있습니다. PCB의 계통 고장이 너무 늦게 감지될 경우, 발생되는 비용이 막대하며 고장의 감지 지연에 따라 증가됩니다. 10의 규칙(rule of 10)은 새 제품의 계통 고장이 나중에 감지될 경우 결함 장치당 비용이 10의 팩터로 크게 증가하는 것을 보여줍니다.

2. PCB 시험의 확대 요건 및 국제적 기준

개발 초기 단계에서 계통 고장의 감지가 절대적으로 중요하다는 사실에 근거하여 PCB의 기계적 품질 점검을 공급업체에 요청하는 OEM 제조업체가 증가하기 시작했습니다.

다음과 같은 이유로 과거 수년간 PCB의 이용이 증가했습니다.

  • 기계적 부하와 관련하여 더 민감하고 더 빨리 균열(변형 유도 파손)이 발생하는 무연납(RoHS 준수, EU 지침)의 사용
  • 표면 실장 소자(SMD) 대신에 볼 그리드 배열(BGA)과 같은 소형 구성 요소
  • 더 높은 기계적 인장을 야기하는 접촉 강성화

IPC(국제전자산업표준협회)JEDEC(합동전자장치엔지니어링협회) – 9704와 같은 국제 협회가 설립되었으며, 이들 협회에서PCB 변형률 측정 수행의 위치, 방법 및 수단에 대한 지침을 제공합니다.

많은 기업들이 조립 시 모든 수동 처리 단계의 실시를 위한 자체 시험 절차를 만들고 관련된 모든 경우를 처리하기 위해 PCB 시험의 시험 계획을 수립했습니다.

3. PCB의 변형률 측정 방법

FEA와 같은 수치 시뮬레이션 방법은 수학적 모델 접근법에 기초하기 때문에 범위가 제한적입니다. 따라서, 보드의 실제 변형 거동을 시험하기 위해 적어도 실제 PCB의 물리적 시험이 추가적으로 필요합니다. CT 및 X선과 같은 기타 시험 방법은 기계적 충격의 영향을 점검하는 데 충분히 적합하지 않을 뿐 아니라 이용 비용이 많이 듭니다. 변형률 값은 PCB의 기계적 변형을 측정하기 위한 유일한 신뢰 값입니다. 따라서, 전기 스트레인 게이지는 매우 정확하게 PCB의 변형을 측정하도록 지정됩니다.  일반적으로 PCB는 크기가 작기 때문에 스트레인 게이지를 이용 가능한 제한된 공간에 설치하는 것은 매우 힘듭니다.

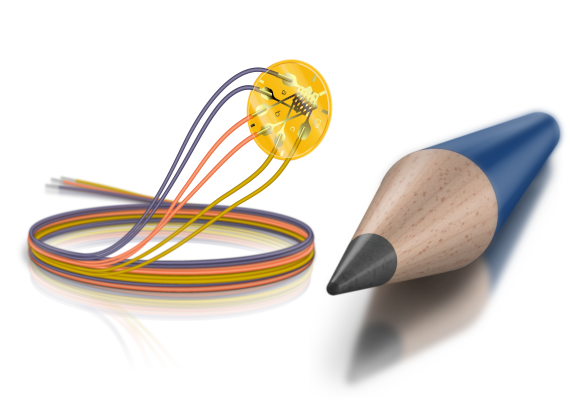
HBM은, PCB 변형률 측정을 위한 특수 스트레인 게이지와 함께, 2000개가 넘는 특별한 용도의 다양한 스트레인 게이지를 제공합니다. 예를 들어 RF91 소형 로젯 게이지경우 소형 구성요소의 변형률을 측정하기 위한 우수한 제품입니다. 이 제품은 여러 버전으로 제공됩니다. 3중 그리드 로제트는 주된 응력의 방향이 알려지지 않았기 때문에 PCB 변형률 측정 응용에 사용됩니다.

RF91은 다음 두 가지 버전으로 제공됩니다.

  • Prewired
  • With integrated solder pads

직경이 5mm에 불과하여 PCB 실장이 용이합니다. RY31-3/120(직경 6.9mm)와 같은 다른 스트레인 게이지도 PCB 시험에 사용할 수 있습니다.

HBM RF91 로제트 게이지에 관한 중요 사항

  • 직경 5mm로 소형 어플리케이션에 적합
  • 저항 120Ω
  • 주된 응력의 방향이 알려지지 않았을 때 2축 인장 상태 측정
  • 3단 측정 그리드
  • 알루미늄뿐 아니라 오스테나이트 페라이트계 강의 온도 보상
  • 사전 배선(0.5m) 또는 납땜 패드형
  • 스트레인 게이지 납땜 없음
  • 2선, 3선 및 특허받은 HBM 4선 구성 사용 가능
     

New: PCB Test Kit

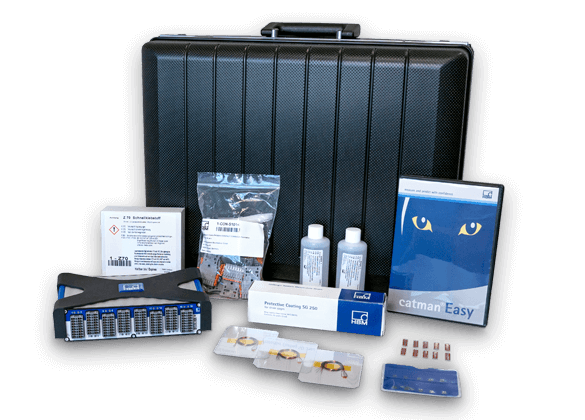
Start your measurement right away with the PCB Test Kit. From the matching strain gauges to the measuring bridge amplifier and the data acquisition software, the kit includes everything you need for strain measurements on PCBs in compliance with IPC/JEDEC 9704.

From the sensor to the result, simply “plug and measure”:

  • Strain Gauges in compliance with IPC/JEDEC 9704 and their installation aids
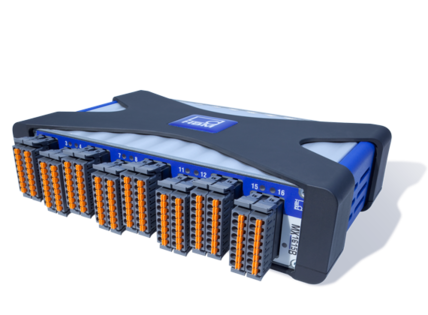
  • QuantumX bridge amplifier module MX1615B
  • Ready-to-use measurement project in catman DAQ Software

To PCB Test Kit

PCB Test Kit Key Facts:

  • Portable and compact case includes all materials
  • Fast, easy and flexible setup – also in different locations
  • Optimal support for every measurement task
  • Fully compatible with all QuantumX modules and catman software packages
  • All products available off-the-shelf for reordering


4. PCB의 변형률 측정 위치

PCB의 인장 상태는 대체로 알려지지 않았으며 기계적으로 복잡합니다. 응력 상황으로 인해 레이트의 변형이 야기됩니다. 플레이트 변형은 선형 정전기학으로 상당히 정확히 설명되는 빔 변형이나 샤프트 비틀림의 전형적 모델을 따르지 않습니다. 게다가 조립된 PCB는 PCB에 다양한 방식으로 납땜처리되거나 연결되는 단일 구성요소를 많이 포함하고 있다는 점이 고려되어야 합니다. 즉, PCB는 소재 특성상 여러 다른 종류로 이루어집니다.

변형 특성 및 거동에 따라 PCB의 모든 단면을 점검하는 것은 시간과 비용 면에서 유용하지도 않고 가능하지도 않습니다. 따라서, PCB의 측정은 다음과 같이 고장 위험이 특히 높을 것으로 예상되는 곳에 설정됩니다.

  • 모서리(Corners): 고정된 경우 모서리는 기계적으로 매우 중요할 수 있습니다.
  • 보드의 강성 부위(Stiff regions of the board); 요소가 클 경우 PCB의 강성이 증가합니다.
  • 상호연결부에 가까운 부위(Regions close to interconnects): 납땜 지점은 수득 강도(Yield strength) 면에 취약합니다.

5. PCB의 RF91 소형 로제트 설치 방법

1. PCB Preparation for Installation


First, the printed circuit board must be prepared for the installation of a foil strain gauge. This video shows the required steps.

2. Bonding of a RF91 Rosette to a PCB


This video illustrates how a rosette is glued to a circuit board using the Z70 quick-curing adhesive.

3. Data Acquisition with a PCB


Finally, the implementation will be illustrated by means of a PCB using a QuantumX MX1615B and the catman software.

QuantumX MX1615B Measurement Amplifier

QuantumX is a modular, freely scalable and distributable data acquisition system from HBM for measurement and testing purposes allowing quicker innovation. All modules offer an Ethernet interface and can be freely combined with each other. All channels work completely time synchronized - module to module with < 1 µs. 

Every channel can be individually parameterized via software, supporting the following:

  • Strain gauges in full-, half- or quarter-bridge (120 or 350 Ω)
  • Standard voltage, PT100, resistor, potentiometer
  • Individual data rates up to 20kS/s per channel, active low pass filter

To QuantumX MX1615B

QuantumX MX1615B Key Facts: 

  • Bridge input, PT100/RTD, voltage, potentiometer selectable for each of the 16 individual 24 bit ADCs
  • DC or carrier frequency (CF) for maximum noise suppression
  • Internal 120 and 350 Ω quarter bridge completion resistor
  • Six-wire technology for full bridge and five-wire technology for half bridge
  • Three- and four-wire technology for strain gauge quarter bridges
  • 20kS/s datarate, 3kHz bandwidth
  • Galvanically isolated (channel to channel, to supply, to network)

6. How to Set Up a Strain (Rate) Measurement in catman®AP

With the HBM DAQ software catman AP, it is easy to set up a PCB board strain measurement. A quick and easy visualization of data is one of the strengths of catman. Data recording can be performed differently using trigger or special time points.

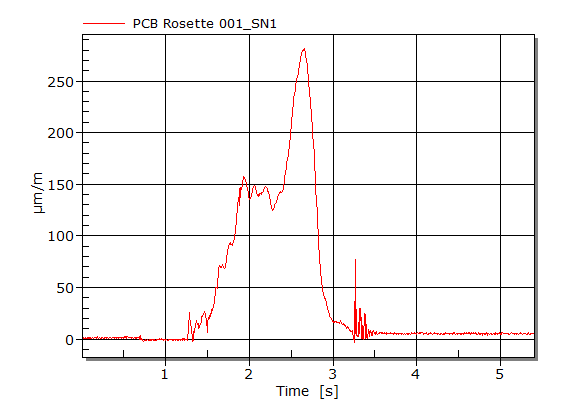
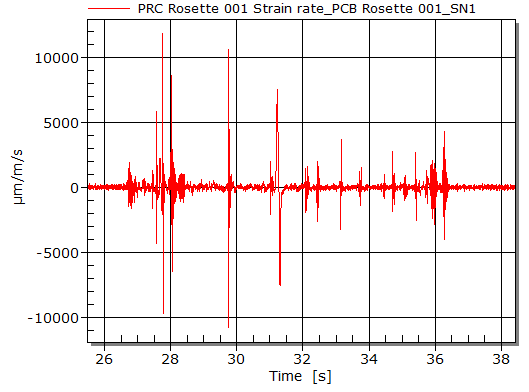
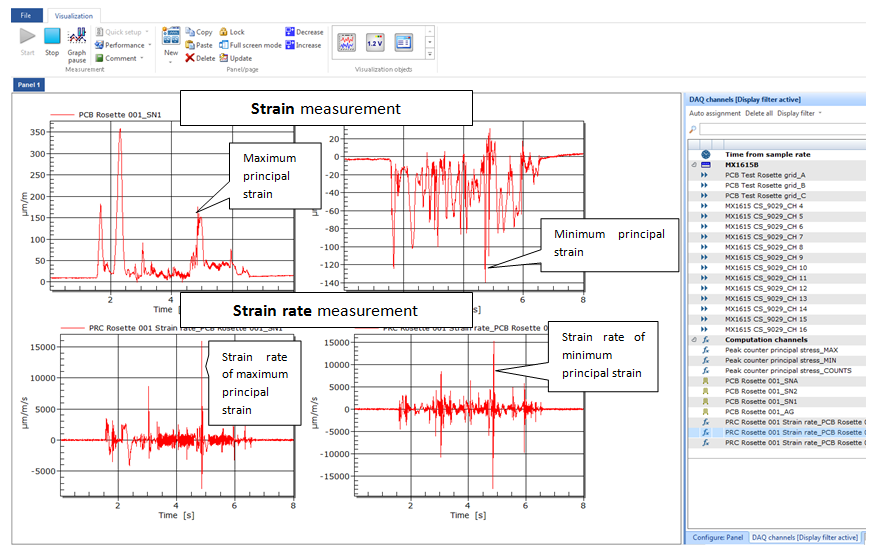
The three measurement grids of the RF91 rosette allow the calculation of maximum and minimum principal strain (rates) as well as the corresponding angles. The latest versions of catman also support strain rate measurement (the strain is derived from the time).

In the subsequent steps, the way to set up a strain rate measurement in catman is shown:

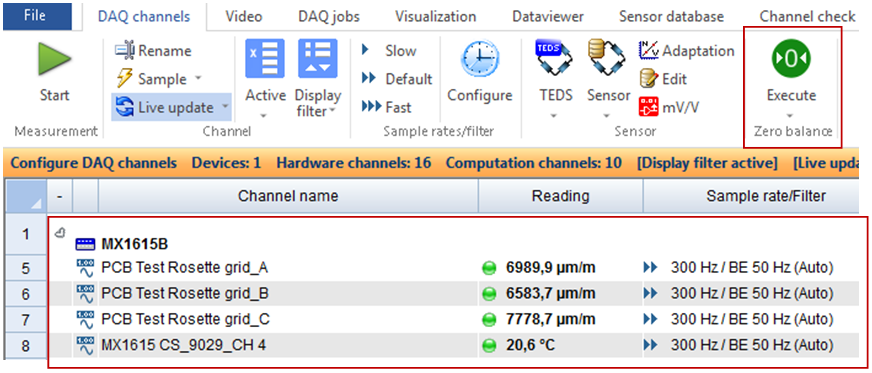
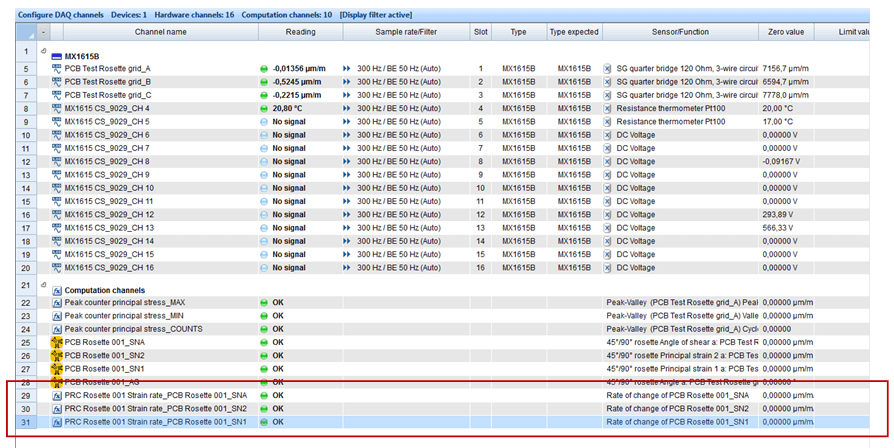
1. Open the catman software and check the relevant channel of the strain gauge. The green lights indicate that the channel is detected and is ready for measurement. In this example, the three grids of the rosette are connected with Channels 1, 2, 3.

catman channel settings


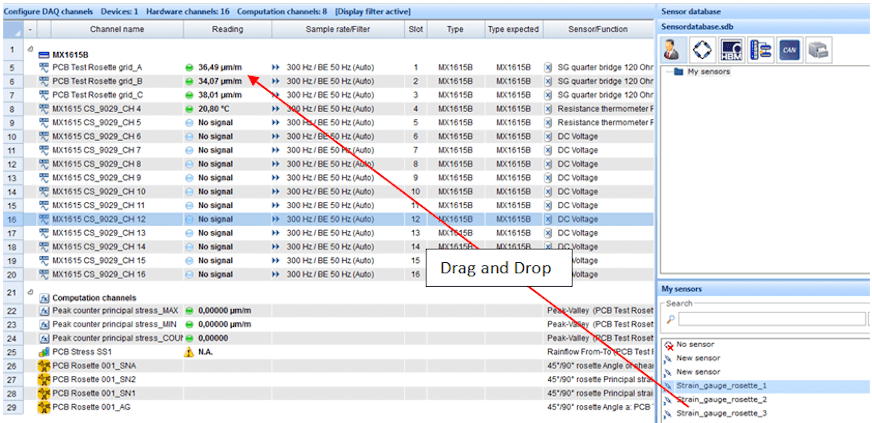
2. Use the sensor database to assign the channels to the sensor application. In this case, drag and drop the 3 wire 120 Ω strain gauge to each of the three active strain channels.

Assigning sensors to channels in catman

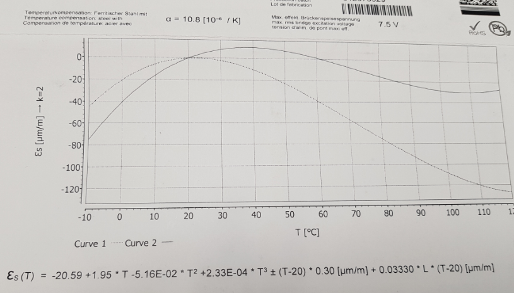
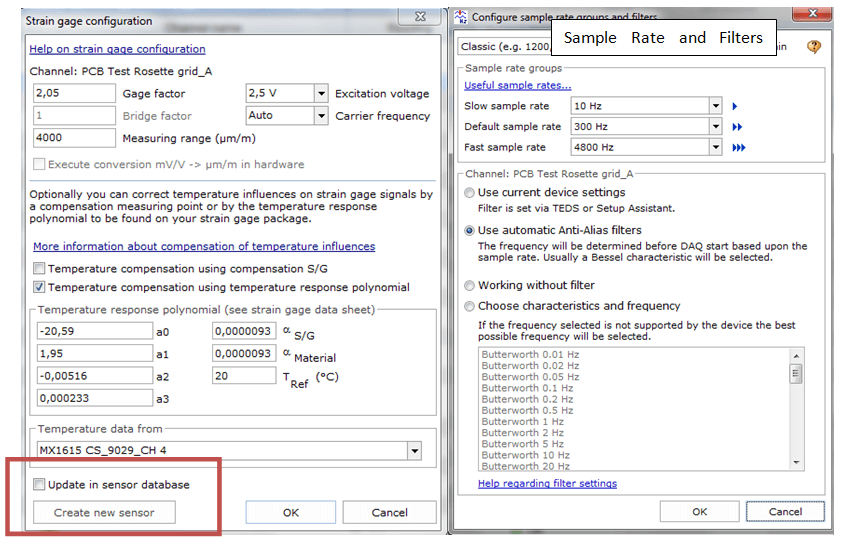
1. Now, the sensor specifications need to be set. Set the correct parameters by using the k-factor displayed on the datasheet of each HBM strain gauge package. Enter the excitation voltage, the bridge factor, and the measurement range. Also ensure that you look at the temperature compensation polynomial if you want to correctly consider the temperature fluctuation material properties.


2. Set the sample rate (classic or decimal) and filters correctly before beginning measurements. Click on ‘Create new sensor’ and activate ‘Update in sensor data base’ to save your parameters in the database.


3. Select all channels and zero the offset of the strain channels of the rosette. The zeroed strain channels appear.

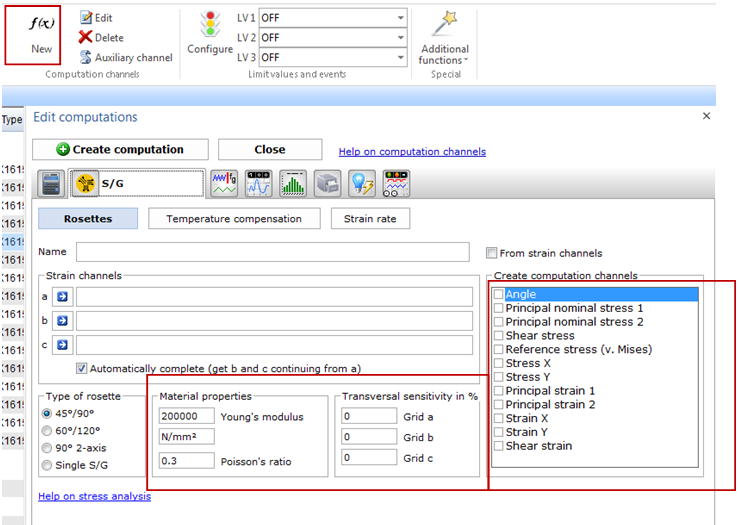
1. Now, we have to set up the rosette calculation channel. A new channel needs to be created, and catman makes it easy for the user to create different setups for rosette calculations.


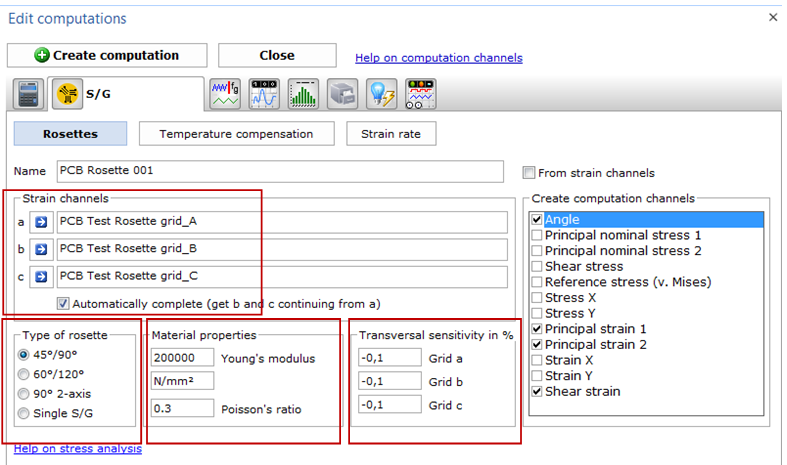
2. Add all three channels in a, b, c and define the material properties and the transverse sensitivity of the gauges. Chose the right rosette type (0/45 or 60/120 for the three grid rosettes) and select the relevant strains (principal strain, shear strain).


3. Click on ‘Create calculation’. Now, the calculated channels appear in the channel list.


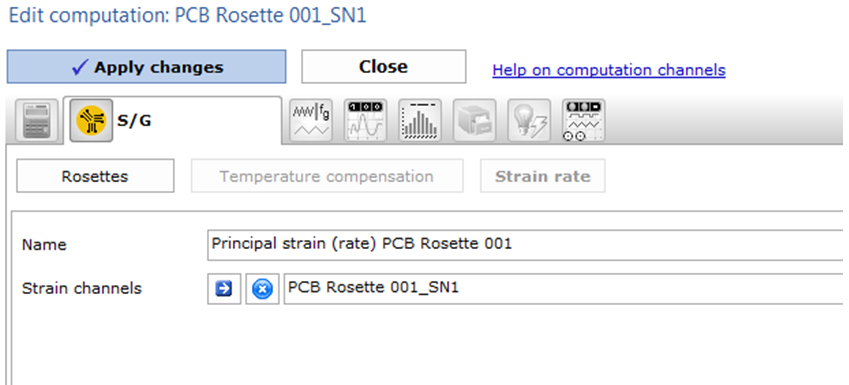
4. Set a name and click on ‘Apply changes’


5. The strain rate channels will appear in the ‘computation channel’ list at the end.

Go to ‘Visualization’ and configure your own GUI

catman®AP DAQ Software

catman®AP from HBM is a powerful software package for PC based data acquisition and data analysis. Thanks to an intuitive user interface, you are only a few clicks away from starting your measurement. Simply configure the amplifier using TEDS, the transducer electronic data sheet, or the extendible sensor database – and the test can start.

Many options for graphical data analysis and versatile export options make catman®AP a reliable and indispensable tool for every measurement technician.

To catman AP

catman®AP Key Facts:

  • Quick and easy measurement results including automated rest procedures
  • Durability testing (rainflow analysis)
  • Modular, free, scalable with regard to channels
  • Real-time and post-processing
  • Maths for rosette calculation
  • Strain and strain rate measurement
  • Report generation and Export Data

7. Data Analysis in catman®

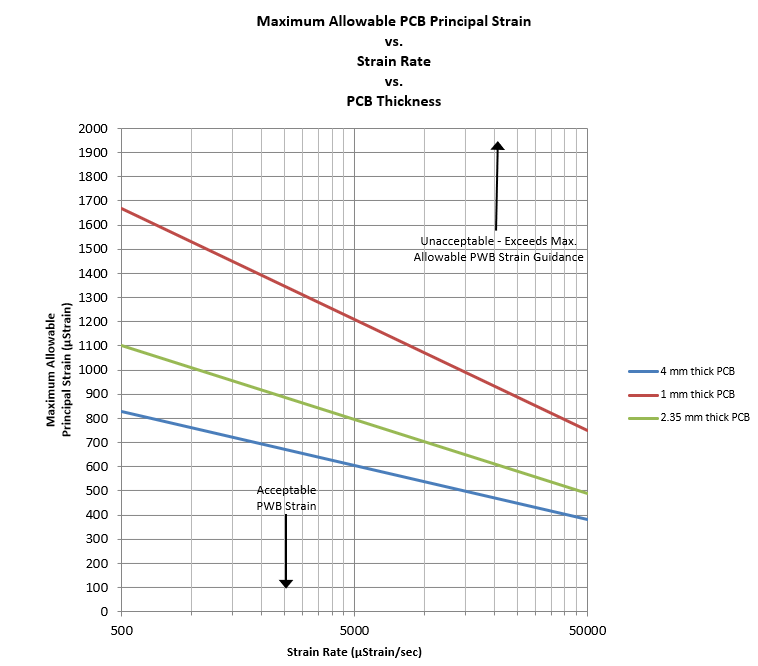
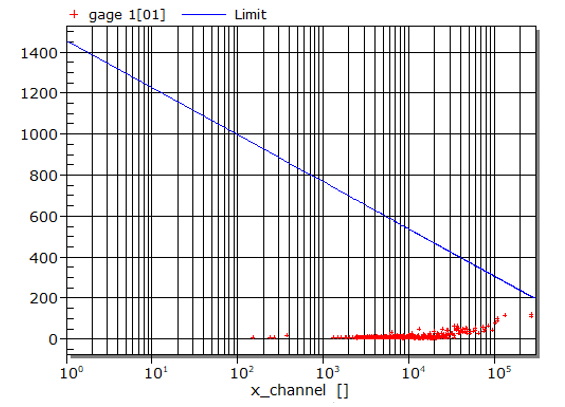
The aim of the analysis is to check if the measured data meets the acceptable criteria for the PCB strain. The following diagram illustrates the boundary lines as a function of the strain rate and the board thickness according to IPC / JEDEC-9704A (2012).

The idea is that the maximum principal strain (Y-axis) should not exceed a certain value. With increased PCB thickness higher principal strains are acceptable. Additionally, another criterion needs to be considered – the strain rate. This means that the lifespan of a PCB is impacted not only by the pure value of the maximum principal strain but also by the speed of changing the strain (impulse). Fast changes in material usually result in earlier micro cracks and material damage.

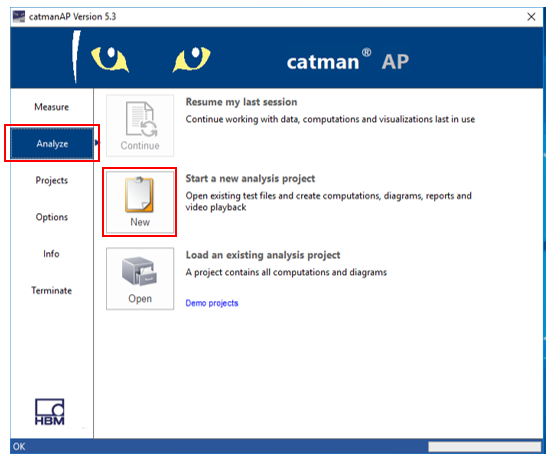
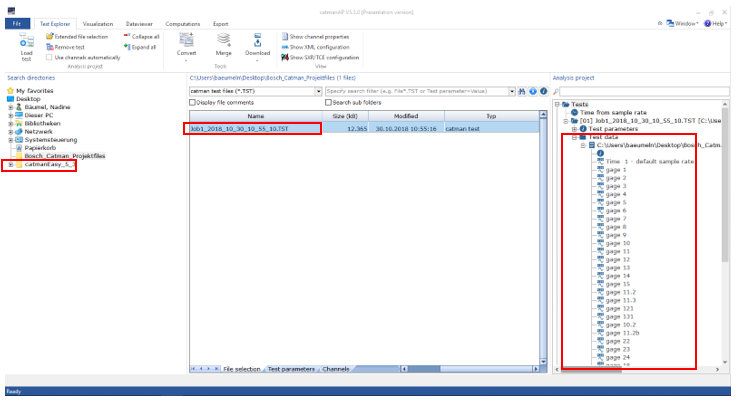
1. 테스트 데이터를 분석하기 위해, catman에서 새로운 Analyze Project를 오픈합니다.


2. 테스트 데이터를 검색하여 오른쪽 열에 끌어다 놓습니다.

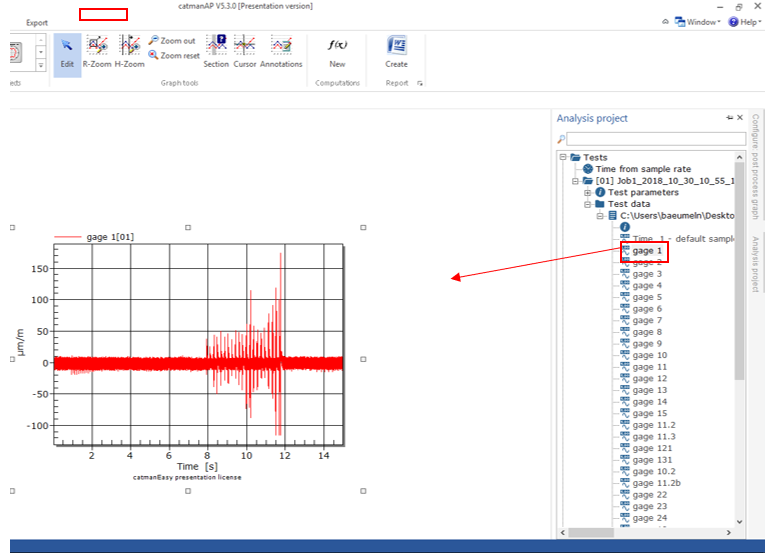
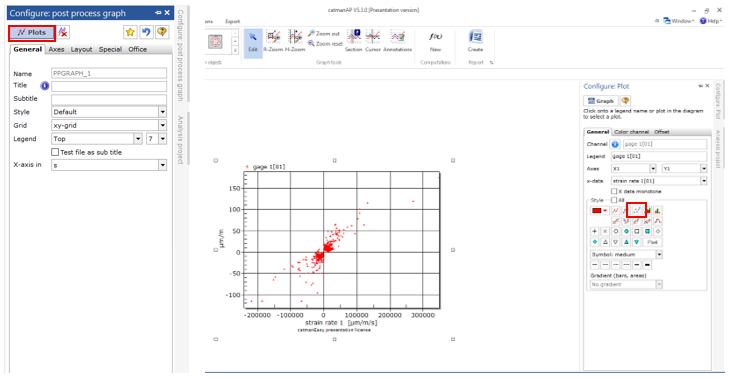
1. '시각화'패널로 이동합니다. Gage 1의 테스트 데이터를 빈 표면에 끌어다 놓아 그래프를 만듭니다.


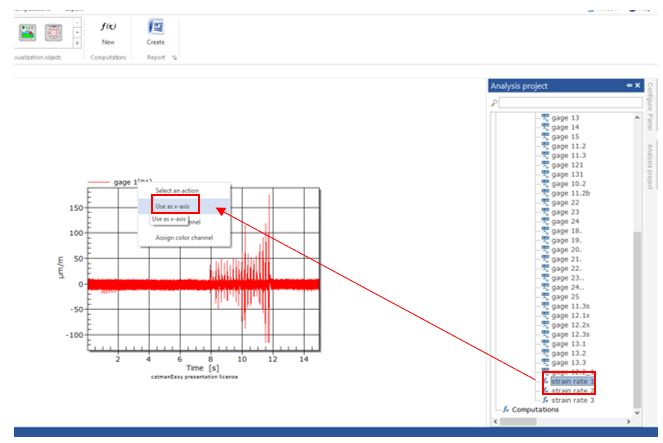
2. 그런 다음 해당 변형률 1을 선택하고 그래프 설명의 텍스트 게이지 1 [01]로 드래그합니다. 변형률 1을 x 축으로 사용합니다.


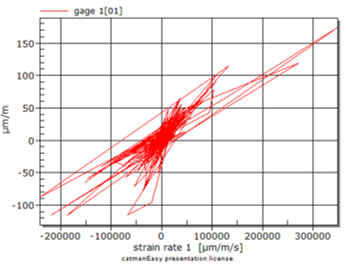
3. 다음과 같은 그래프가 나타납니다.


4. 원하는 그래프 모양이 아니므로 다음과 같이 플롯을 구성하십시오 (점선 스타일).


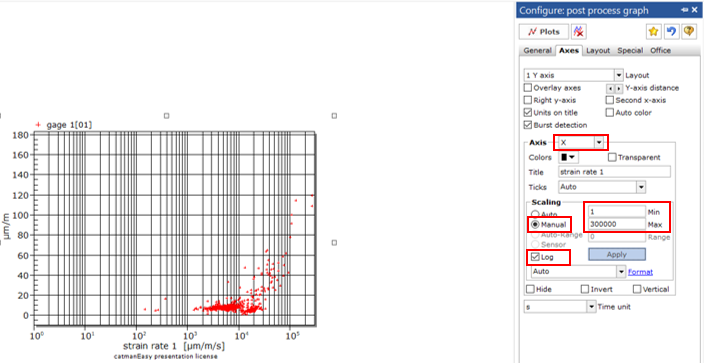
5. 수동 로그 스케일링을 선택하여 x 축을 조정합니다.

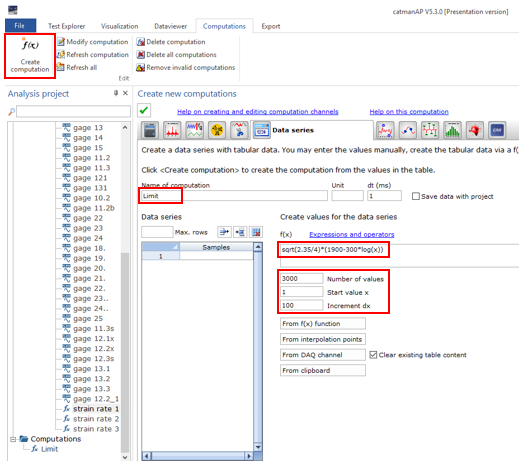
1. 한계선을 그리려면 다음 데이터 시리즈 기능을 정의하십시오 (IPC / JEDEC-9704에 따름).

Max. allowable strain = sqrt[2.35/(PWB thickness)]*[1900-300*log(strain rate)]


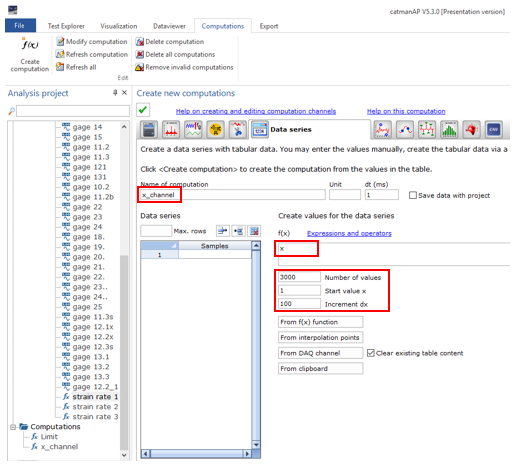
함수로 x


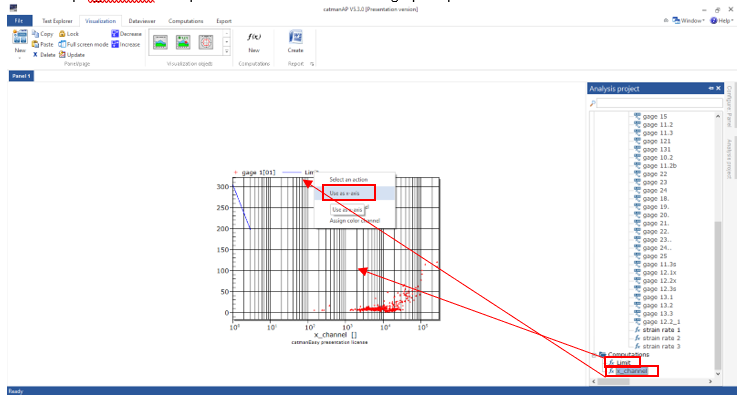
1. 마지막으로 계산 된 함수를 시각화합니다. '한계'계산을 표시된 그래프로 끌어다 놓습니다. 그런 다음 'x_channel'계산을 그래프 설명의 한계로 끌어다 놓고 x 축으로 사용합니다.


2. 결과 그래프는 다음과 같습니다.

IPC / JEDEC-9704 인쇄 배선판 스트레인 게이지 테스트 가이드 라인에 따라 측정 된 스트레인은 허용 가능한 스트레인 범위 내에 있습니다. 따라서 테스트된 PCB는 제조 과정에서 손상되지 않습니다.

8. Glossary

  • BGA: Ball Grid Array
  • FEA: Finite Element Analysis
  • ICT: In-Circuit Test
  • JEDEC: Joint Electron Device Engineering Council
  • PCB: Printed Circuit Board
  • SMT: Surface-Mounted Technology


Download as PDF


Legal Disclaimer: TECH Notes are designed to provide a quick overview. TECH Notes are continuously improved and therefore, change frequently. HBM assumes no responsibility for the correctness and/or completeness of the descriptions. We reserve the right to make changes to the features and/or the description at any time without any prior notice.